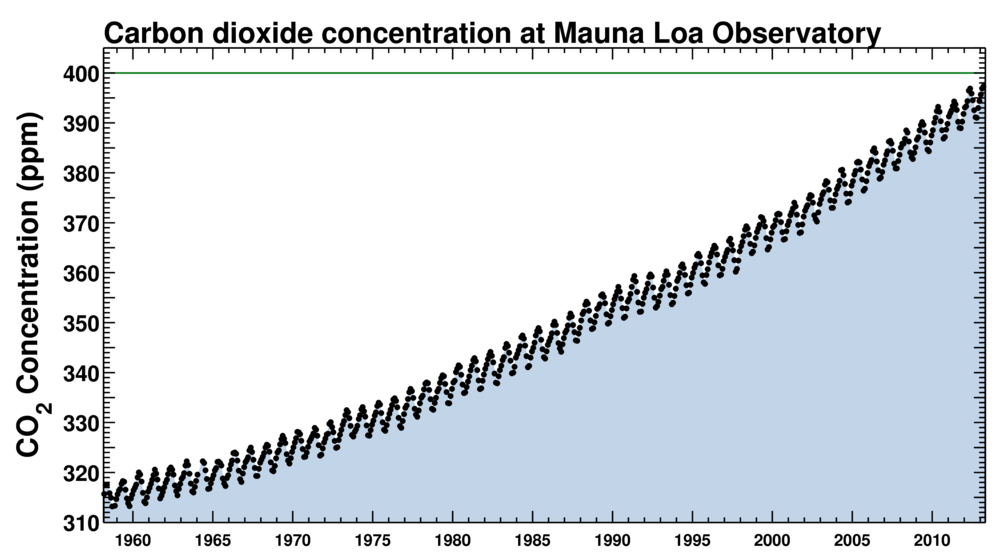
The Earth inhales and exhales cyclically. In the northern winter when plants are dormant CO2 spikes while the opposite occurs on the southern half of the planet. We have been measuring Earth’s breaths at the Mauna Loa observatory in Hawaii since 1958. Today our world is exhaling more CO2 than it ever has in modern times and you can follow each breath on Twitter. Current readings are 399.50 parts per million of CO2.
The graph that appears below is known as the Keeling Curve, names after Charles Keeling, the scientist who began documenting fluctuations in atmospheric CO2 back in 1958. Mauna Loa is a good site to do atmospheric data collection because it is far from any major continental land mass. When Keeling started measuring back in 1958 CO2 levels were 317 parts per million. If you subscribe to the Twitter feed you can witness when CO2 passes 400.
We have only measured CO2 at Mauna Loa since 1958 but we can sample old air trapped as bubbles in ice cores from the Antarctic and Greenland. These bubbles date back to the Ice Age when CO2 concentrations varied from 200 to 300 parts per million. We also can measure historic CO2 levels using geochemistry allowing us to go back even further, millions of years in fact, to a time before humans existed. At that time between 3 and 5 million years ago, the Mid-Pliocene, mean global temperatures were 2 to 3 Celsius (3.6 5.4 Fahrenheit) degrees higher than today. The polar areas of the Mid-Pliocene were much warmer with temperatures 10 Celsius (18 Fahrenheit) degrees higher on average. With warmer poles, polar ice cap melting caused sea levels to rise between 5 and 40 meters (16 to 131 feet). As evidenced from the fossil record, tropical flora and fauna both on land and sea migrated toward the poles. Even Ellesmere Island, high in the Canadian Arctic, had forests where today there is just ice, moss, lichens, scrub grass and bare rock.
So in the next few months with the average annual rise of atmospheric CO2 at 1.9 parts per million we should see 400 breached and you can be alerted on Twitter the moment it happens. Something to tell your children and grandchildren about.
Al Gore writes in The Future, a book I recently reviewed, “Roughly a quarter of the 90 million tons of global warming pollution we put into the atmosphere each day will still linger there — still trapping heat — more than 10,000 years from now.”
It is a sad statement about our human nature that we choose not to solve this CO2 challenge by an all out effort to move away from fossil fuel-based energy generation. The problem and evidence is staring us in the face and yet only 2% of our present energy consumption comes from renewables today. The rest involves burning carbon. This carbon legacy will continue to be measured by the Keeling Curve in coming decades as we surpass 400 this year and watch the number climb to 450 by 2040 even if we mitigate our carbon burning ways starting now. And we must.


|You can see from the graph that there is a slight acceleration in the rate of buildup of CO2 over the last 10 years. I think if you look at graphs that go even further into the past you will see an acceleration over the last century.