The headlines in today’s newspapers imply that global warming and surface melt over Greenland are linked. The truth is – there’s no way to know. Global warming is a phenomenon measured over time based on analysis of data and projected trends. Because humans have been keeping the kind of data that supports the thesis of global warming for a century and a half it makes it harder to definitively state that what we are witnessing is human induced.
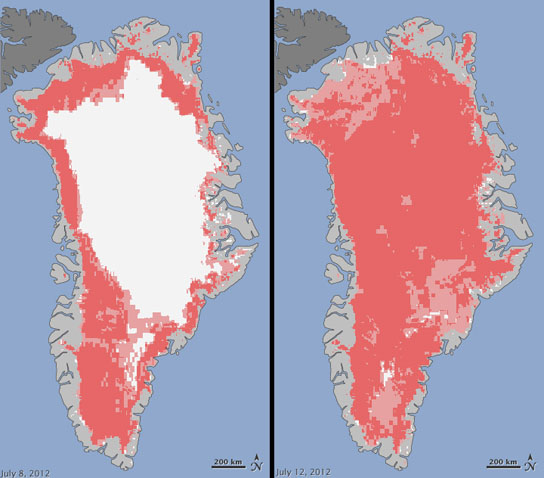
So let’s look at what we know about the surface melt over Greenland this summer. Satellite images from two dates, the first July 8, and the second July 12, 2012, show a change in the thawing of the ice at or near the surface of the island’s massive ice sheet. I’ve reproduced the images below. The one on the left shows about 40% of the ice mass undergoing surface melting. The one on the right shows 97% of the ice mass experiencing surface melting. The darker pink indicates absolute certainty that melting is occurring corroborated by two or three satellites. The lighter pink areas are probable melting zones corroborated by one satellite. This is a dramatic jump from previous years.
At Greenland’s highest point, 3.2 kilometers (2 miles) above sea level melting was observed. Melting of this kind at this location has not occurred since 1889. We know this because we have sampled ice cores from this area. And something else those ice cores show us – melting of this type seems to occur every 150 years give or take a margin of error. So from 1889 to 2012 we have 123 years. Is that within the margin of error seen from historic records? Only time will tell.

Satellites have been observing Greenland for 30 years. Melting occurs every summer with the average melt impacting 50% of Greenland’s surface ice. Most of this water inland refreezes in place. Some tunnels down through the ice forming underground rivers that increase the ice viscosity on down slopes. And near the ocean edge, melting at the surface runs off or in tunneling increases the flow of ice and formation of ice bergs.
The satellites that recorded the data to create these maps included NASA’s Terra and Aqua satellites and the U.S. Air Force’s meteorological satellite, Oceansat-2. Unusual weather is blamed for what is truly an unprecedented amount of surface melting. Greenland has experienced a strong series of warm high pressure ridges since the end of May with each warmer than the last. The current ridge began dissipating on July 16. Prior to that daytime temperatures in central Greenland hovered around zero Celsius (32 Fahrenheit).

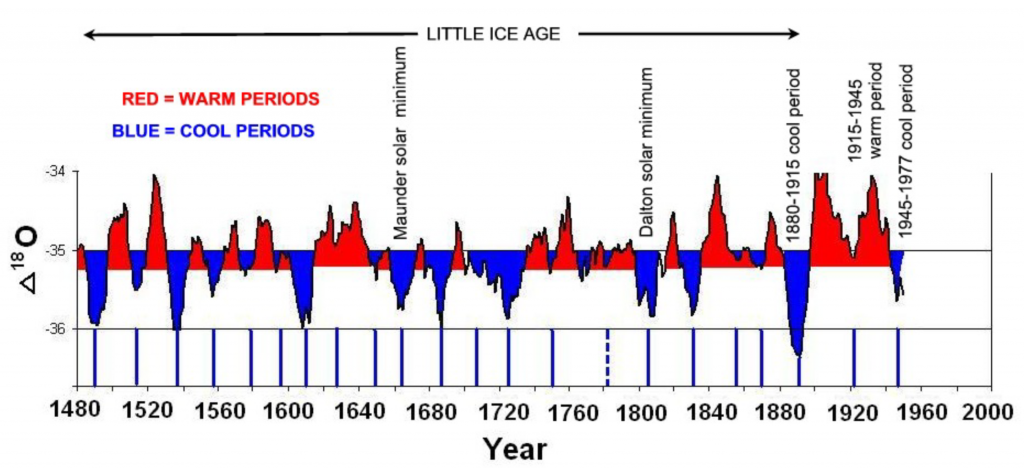
We need to separate this recent observation from the climate change debate. Ice core data from Greenland is the best way to do this. Take a look at the above chart. It shows the periodicity of warming and cooling of Greenland’s ice sheet. We cannot blame past oscillations on our Industrial Age and rising CO2. The historic data, therefore, arguably demonstrates that what we are observing today may be caused in part by other variables. So having given the global warming deniers their due I leave the last word for the scientists who reported their findings. One of them, Lora Koenig, of the Goddard Space Flight Center, stated, ” Ice cores…show that melting events of this type occur about once every 150 years on average. With the last one happening in 1889, this event is right on time….but if we continue to observe melting events like this in upcoming years, it will be worrisome.”


The reason that past variations in Greenland temperature aren’t correlated with atmospheric carbon dioxide might be something to do with the fact that, over the period in question, atmospheric carbon dioxide levels barely changed. Between 1000 and 1900, they stayed between 270 and 300 parts per million. They’re now at 394 ppm and rising rapidly.