August 12, 2014 – Robert Rubin, Co-Chair of the Council on Foreign Relations in the United States says that not acting on climate change will take down the economy.
In an opinion piece posted in the Washington Post, July 24, 2014, Rubin, Treasury Secretary from 1995 to 1999, says,
“When it comes to the economy, much of the debate about climate change − and reducing the greenhouse gas emissions that are fueling it − is framed as a trade-off between environmental protection and economic prosperity….but from an economic perspective, that’s precisely the wrong way to look at it. The real question should be: ‘What is the cost of inaction?’”
In June the Risky Business Project, provided a published 56-page report on the impact of climate change on the economy. Initiated by a non-partisan panel of former Treasury Secretaries, it states,
“if we continue on our current path, many regions of the U.S. face the prospect of serious economic effects from climate change. However, if we choose a different path—if we act aggressively to both adapt to the changing climate and to mitigate future impacts by reducing carbon emissions—we can significantly reduce our exposure to the worst economic risks from climate change, and also demonstrate global leadership on climate.”

Rubin believes that taking action will be far less costly than doing nothing. Because in one example by doing nothing, he points out,
“By 2050 between $48 billion and $68 billion worth of current property in Louisiana and Florida is likely to be at risk of flooding because it will be below sea level.”
And Rubin continues to describe other scenarios like unpredictable and sudden super storms – hurricanes, tornadoes and severe thunderstorms. Just two hurricanes in the last decade, Katrina and Sandy, caused $193 billion in economic damage and $122 billion in government relief.
Rubin also talks abut rising temperatures and the potential impact on employment and economic productivity, let alone premature heat-related deaths estimated at 65,200 plus per year.
He concludes,
“We do not face a choice between protecting our environment or protecting our economy. We face a choice between protecting our economy by protecting our environment − or allowing environmental havoc to create economic havoc.”
Every decade we delay implementing measures to combat climate change will increase costs to the economy by 40%. Now if only the Congressional ostriches would take their heads out of the sand, the government could begin the job of developing policies and the funding to mitigate climate change risk now. Delay, according to Rubin, the reinsurance industry, and thousands of American scientists, will lead to costs that could ultimately tear the economy to shreds.
For those who sit north of the 49th parallel, here in Canada, the same holds true. Canada’s federal government is exhibiting the same behaviours as our American cousins, and this will lead to similar results.
Related articles across the web


Related Posts
 Should the U.S. Power Grid Move Underground?
 If You Are Using Semaglutide Drugs to Lose Weight Are You Hooked on Them for Life?
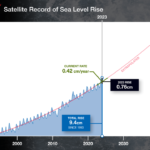 New NASA Report Shows Sea Level Rise Is Accelerating: Causes and Consequences
 Banana Monoculture Is At Risk Without GMO
 Safe and Efficient Charging Is Needed to Support the EV and Carbon Transition
 New Gene Editing Cas-CLOVER Adds an Alternative to CRISPR/Cas9
 High Speed Internet Coming to Space
 How Close Are We To A One-And-Done Vaccine For COVID-19 And Other Viruses?


Can you post a chart or graph showing mean global sea level only in the decade from 2004 to 2014? I find it curious that a Google search doesn’t quickly turn up something useful. I’m wondering if a good look at an actual empirical graph wouldn’t allay a lot of flooding concerns. Are real estate values plummeting in south Fla?
You specifically ask for data from 2004 to 2014. What can be found in IPCC aggregated data is mean sea level trending from 1870 to 2003. This includes satellite altimetry from 1993 to 2003 and comes in at 2.8 mm per year +/-0.7 mm. Of this thermal expansion accounts for 1.6 and changes in land ice 1.2. Rates across the globe vary with some regions experiencing higher sea level increases while other areas have seen a fall. Obviously we need to continue to monitor sea level changes. I refer you to http://www.ipcc.ch/publications_and_data/ar4/wg1/en/tssts-3-3-3.html for more details.
Specifically it is interesting to look at changes in mean sea level as charted for a city like New York. Battery Park is the location of continuous data collection on mean sea level in that part of the world. Here the trend is 2.77 mm per year +/-0.99 mm on data from 1856 to 2006. The net change over 100 years equals 27.7368 cm or 0.91 feet. I refer you to http://tidesandcurrents.noaa.gov/sltrends/sltrends_station.shtml?stnid=8518750 for additional information.
Interesting, new satellite data shows Arctic Ice has grown 43%. How is that explained? Is Mr. Gore’s Climate Change Hysteria in the same realm as the Hogwarts Economy? I think so!
Furthermore, why are all the scientists who oppose Gore’s hysteria actual scientists with degrees in such fields as physics, chemistry, meteorology, and engineering while those who trumpet his nonsense are economists, political scientists, and sociologists? Al Gore, proof that privilege and education can be mistake for intellect.
Don’t quote inaccurate sources. This is bogus data. In 2014 Arctic sea ice was at its fifth lowest maximum. The linear rate of decline has been 2.6% per decade. You have completely taken the reference to 43% out of context. It refers to a comparison of multi-year icepack at 30% the previous year. There is no recovery of Arctic sea ice and anyone writing about the subject as are many are feeding the climate change deniers a crock they will gladly run with.