
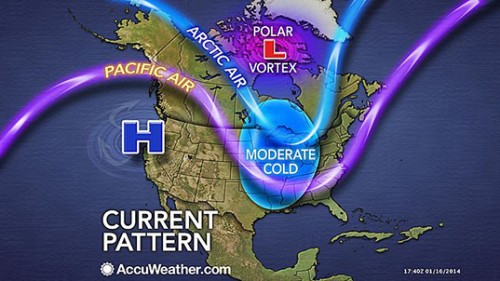
May 31, 2015 – It’s May 31st and here in Toronto the temperature has already hit the high for the day, 10 Celsius (50 Fahrenheit). That’s after a week of well above average temperatures rising into the mid and high 20s. When you look at a weather map you see why we have gone from above to below normal in a blink of an eye – the new normal Jet Stream with its long looping path that winds across North America from its arrival on the west coast to its skirting of the Arctic at mid-continent and then deep dive into the south and south central with a final hard swing to the northeast. It’s a pattern that keeps repeating itself and very much looks like the one seen on the map below from 2014.
May in Toronto was one of the driest on record until yesterday when we almost made up the volume to equate with an average month, most of it falling in one day. This continues to be the new normal in Toronto where we experienced a deep freeze in February and a very late spring, a frost in late May that killed some of my flowering potted plants and a good percentage of the wine grapes in the Niagara Peninsula just to the south of the city.
How does the pattern of the Jet Stream relate to weather extremes in North America?
In our data keeping on the Jet Stream the pattern of the last decade is decidedly different from the past. The occurrence of a pattern of upper atmospheric air movement that curls and dips into the mid and semi-tropical latitudes is pulling lower atmospheric air from polar regions driving it south. This languid oscillating movement is pushing warm dry air into the Pacific Northwest and drying out much of the United States Southwest in the process.
Climatologists believe increasing Arctic sea ice melt and with it the longer exposure of open water to the atmosphere and solar heating is playing a part in altering high atmospheric wind patterns. Arctic summers are getting warmer faster than any other place on the planet. If the jump in mean temperatures at mid-latitudes is 1 degree Celsius (1.8 Fahrenheit), its counterpart in the Arctic is closer to 4 to 5 degrees Celsius (7 to 9 Fahrenheit). That warming means weather patterns over the Arctic are being altered.
At the same time we have the oscillations of El Nino and La Nina events in the mid-Pacific with winds driving the air above the warming ocean into western North America, and counter winds driving warmer ocean water into the Indian Ocean with some implications for weather in that part of the world. We’ll get to that in a minute.
So Toronto isn’t alone in experiencing “extreme,” the new normal.
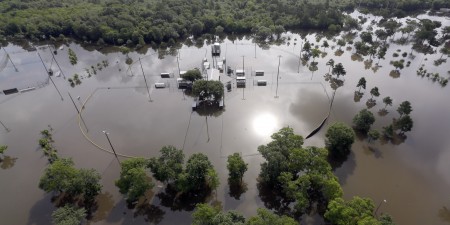
Look at the headlines of the last couple of weeks. A decade long drought in Texas and Oklahoma comes to an abrupt end when historic high rainfalls inundate these states causing massive floods, leaving thousands homeless and killing dozens.
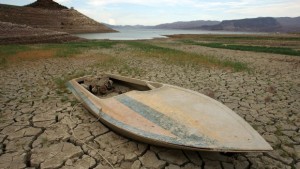
In California climatologists describe the drought crisis in terms that begin with the prefix “mega.” One scientist recently described the situation as no longer being “up a creek without a paddle” but instead “we’re losing the creek too.”
In Northern Alberta, where forests have been devastated by Mountain Pine Beetle, now surviving warmer Canadian winters to reproduce twice a year, tinder-dry conditions combined with unprecedented warm and dry weather have led to a devastating outbreak of 63 wildfires isolating communities, causing evacuations and halting 10% of all oil sands production in the province. The wildfires with no vegetation to hold the mountainsides contribute to mudslides when the occasional rain falls.
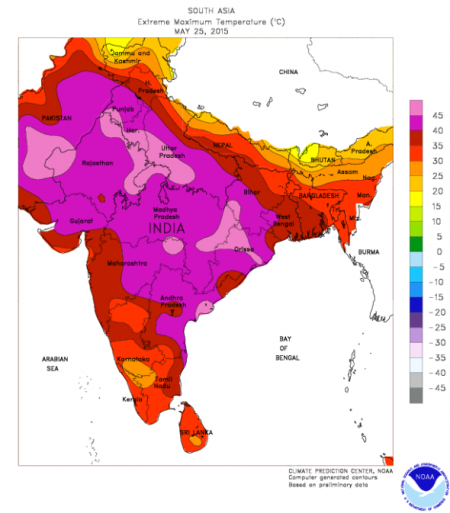
And in India, the May heat that normally precedes the onset of the annual monsoon turns deadly with daytime temperatures approaching 50 degrees Celsius (122 Fahrenheit) leading to more than 2,000 extreme heat deaths. Indian climatologists describe 2014 as the hottest year on record and predict heat stress will continue to grow through the mid-century further exacerbated by rural to urban migration where the urban heat island effect will make things even more extreme. Forecast higher temperatures in the 2020s – 50+ Celsius and by 2080 – 55 Celsius (131 Fahrenheit).
Is extreme weather attributable to global warming and climate change?
Scientists have been cautious to date in linking the two. They have avoided associating events like Hurricane Sandy and Katrina with global warming. Instead they have argued the likelihood of extreme weather events may go up when oceans get warmer and the air over them gets stirred up.
But now some are throwing caution to the wind making statements that argue that climate change affects all weather and storms. Kevin Trenberth, a climate scientist at the U.S. National Center for Atmospheric Research, in Boulder, Colorado, states that weather and storms “cannot not be affected. The risk of drought and flood is greater, and so are heat waves and wildfires. There is excellent evidence for all of these things happening.”
In the most recent research papers on climate some scientists are attributing 75% of the world’s hottest days and 18% of precipitation extremes to climate change. In an April posting to letters in Nature Climate Change, entitled, Anthropogenic contribution to global occurrence of heavy-precipitation and high-temperature extremes, the authors demonstrate that global warming and observed increases in extreme weather are inextricably linked. They state, “Significant trends in temperature and precipitation extremes over the recent decades have been observed and attributed to human influence. Although none of these extreme events was exclusively anthropogenic in a deterministic sense, climate change has changed their odds, which can be expressed as a change in the fraction of attributable risk.” The percentiles at the beginning of this paragraph are theirs.
The implications for a mid-latitude country like the United States are enormous. With the pattern of demographic change flowing from the northeast to the southwest, the U.S. will be increasingly subjected to extreme heat days and extreme heat deaths as the population continues to age. In a paper published on May 18th of this year in Nature Climate Change, researchers project a four- to sixfold increase in extreme heat exposure in the continental United States by the latter half of the 21st century. They attribute their forecast to climate change and population redistribution.
And if you by now are not convinced that atmospheric warming and extreme weather correlate then consider the following tornado study that looked at multiple-tornado day frequency. It appeared in the August 2014 issue of the journal, Climate Dynamics. Researchers studying tornado occurrences found sufficient evidence to link the occurrence of multiple-tornado event days with atmospheric warming and state, “The bottom line is that the risk of big tornado days featuring densely concentrated tornado outbreaks is on the rise….consistent with numerical modeling studies that project increases in convective energy within the tornado environment.” Convective energy, just another way of saying global warming.
Related articles across the web


Related Posts
 Hydrogen From Ammonia or Ammonia Itself May Power Our Future
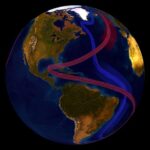 It’s the Middle of February and I Just Came in From Sitting on My Balcony
 For Today’s Internet Virtual Private Networks Make Sense
 Dark Matter and the Cosmic Web in the News
 Was Carl von Clausewitz Right Describing War as a Form of Policy?
 The Saga of Honeybee Colony Collapse is Being Questioned
 New Gene Editing Cas-CLOVER Adds an Alternative to CRISPR/Cas9
 When It Comes To Hunting For Life on Exoplanets Purple May Be The New Green


