August 7, 2015 – One trillion is a big number. And when it comes to carbon dioxide emissions it represents what scientists believe is the absolute limit of that gas in our atmosphere. One trillion translates to a peak of 450 parts per million (ppm).
In a 2009 study reported in Letters in the journal Nature physicist Myles Allen, University of Oxford, gave that one trillion number as the amount of metric tons of atmospheric CO2 to cause peak warming of 2 Celsius (3.6 Fahrenheit) degrees.
So where are we now?
The number today is 600 billion, 60% of the way, increasing by 50 billion metric tons per year. That means 8 years from now based on current CO2 emissions we will hit one trillion.
How do we then get to where we need CO2 levels to be?
Today at 400 ppm we are already seeing the creep of atmospheric warming leading to extreme weather events which scientists now describe as anthropogenic. That means 400 is not a very sustainable target. Climatologists argue we need to get back to levels below 1950, just under 316 ppm. To do that we have to change the way we create energy in a world where energy demand is increasing as world population grows.
For those who point to population as the real problem and not carbon in the atmosphere I say this:
They go together.
And even if we wrestle population growth to zero by mid-century, aspiring developing nations will still need more energy than they have capacity to produce today. So energy demand overall will rise even as the population curve peaks and begins to decline.
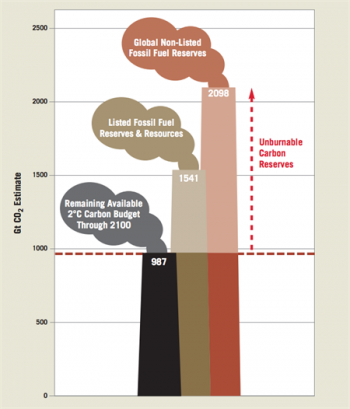
For those coming to agreement in Paris at COP2015, it means leaving 25% of known fossil fuel reserves in the ground as unrecoverable, the so-called stranded assets scenario that energy companies are facing now and in the future.
In the United States this week, President Obama announced a 32% reduction target for carbon emissions from energy providers. The reduction is being measured from 2005 levels, not 1950 or even 1990.
Will that number get us to stay below one trillion?
No.
If the President were seriously engaged in the climate file then he would be establishing a real target to be 80% to 90% below 1990 levels by 2050.
If the rest of the world were to follow suit it would mean a global 50% reduction in CO2 emissions by 2050. That’s how heavily weighted the United States is in the scheme of things, the largest CO2 and greenhouse gas emitter.
Will we be off the hook if we keep the temperature from rising beyond 2 Celsius?
If you live in a coastal city the answer is no.
If you live on an atoll island in the Pacific or Indian Oceans you will be emigrating.
Sea level rise will prove to be the most consequential result from anthropogenic warming of our atmosphere.To put perspective on this, the last time our Earth experienced atmospheric mean temperatures 2 Celsius warmer than today was 120,000 years. At that time sea levels rose between 5 and 10 meters (16.4 to 33 feet).
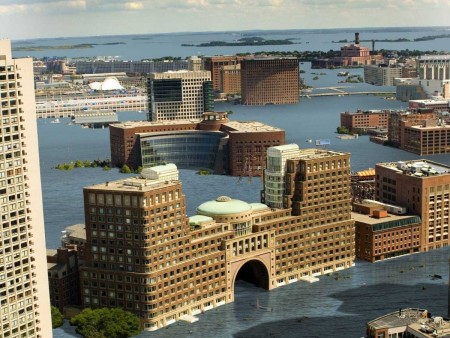
What would a 5-meter rise mean?
The disappearance of Lower Manhattan, downtown Boston (artist rendering depicted below), all of New Orleans, most of Miami-Fort Lauderdale and Palm Beach, Washington, DC and the Chesapeake Bay area, The Hague, almost all The Netherlands, Bangladesh, Singapore, the Maldive Islands, downtown Tokyo, Venice, Dublin, London, Cairo, Copenhagen, and Brisbane to name just a few.
The graphs below from the University of Oxford study illustrate a series of idealized (not my word because it is hardly ideal) CO2 emission profiles along with correlated temperature response benchmarks. The various lines show different scenarios. The solid red and orange lines represent cumulative emissions within 1% of one trillion. The red lines in the composition and temperature graphs (the two on the right) project the consequences of one trillion to the year 2500. The dotted red lines in both graphs plots a peak warming profile based on 490 ppm of CO2.
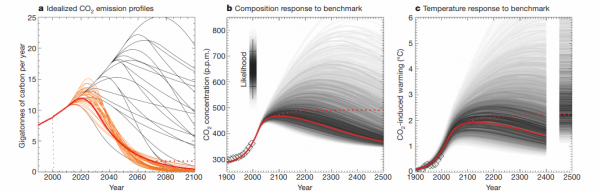
In previous postings I have described how carbon emissions created today have consequences for the generations that follow. We are the current victims of the CO2 spent into atmosphere from a century ago. And what we do today and tomorrow will impact the planet for centuries into the future. That’s why the graphs plotting scenarios to 2500 should be considered in any climate change policy action.
So you wonder why political leaders struggle to grasp the creeping crisis. They truly are the frogs in the warming pot on the stove. They are riveted in the here and now of 4-year election cycles. They’re not thinking a century ahead let alone five and as a result they have little to offer on the climate change file.
Having said that the political meetings in Paris occurring before the end of this year are focused on the subject. It is for all who read this posting, or see it on Facebook, LinkedIn and Twitter, to contact those who govern to ensure that leaders’ actions speak louder than their words.
Related Posts
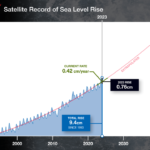 New NASA Report Shows Sea Level Rise Is Accelerating: Causes and Consequences
 Will Americans Stage a “Managed Retreat” from Their Coastlines?
 Tech-Philanthropists Playing Same Role as the “Robber Barons” of the 19th Century
 Transforming Coffee’s Future With Bioreactors And Cell Power
 Hydrogen From Ammonia or Ammonia Itself May Power Our Future
 It’s the Middle of February and I Just Came in From Sitting on My Balcony
 New Gene Editing Cas-CLOVER Adds an Alternative to CRISPR/Cas9
 Autonomous Vehicles, Artificial Intelligence and The Internet of Things


