
November 18, 2016 – Sea ice in the Arctic reaches seasonal lows in September each year. This year was no different other than the fact that the ice cover this year was even less than in 2012, the lowest recorded year for September sea ice coverage. That’s not weird but it is indicative of the recent history of sea ice coverage in the Arctic which is trending downward.
So what’s weird? Well the Arctic above 80 degrees north is now dark 24 hours a day. This should be deep freeze time but strangely it isn’t. Take a look below at the temperature graph recorded Tuesday, November 15th by the Danish Meteorological Institute. The Danes who own Greenland are leaders in studying changes to the Arctic.
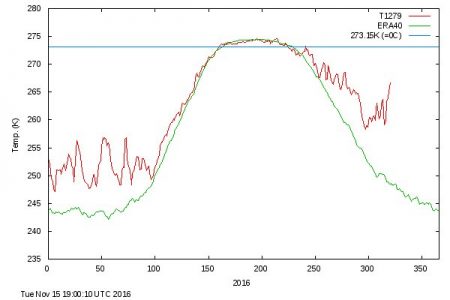
The red line traces daily mean temperatures. Note the unusual nature of the plot line when compared to the green line beneath which represents mean historic temperatures plotted over a 45-year period beginning in 1957 through 2002. Daniel Swain, climate scientist at UCLA describes what is being observed as “extraordinary.” Temperatures are 20 Celsius (36 Fahrenheit) warmer than normal over most of the Arctic Ocean. A similar spike was observed in 2015 but this one is even more extreme.
What could be the cause?
Speculation is low sea ice, thin sea ice, and a jet stream that no longer acts the way it has in the past. Low sea ice exposes more ocean water to the air above it acting as a heat exchange. Thin ice absorbs more solar energy when the Arctic is in daylight because it is more transparent. And less ice means greater ocean turbulence which further depletes ice coverage.
The excessive warmth in the Arctic combined with the jet stream oscillations is causing extreme cold in Siberia. Meanwhile Canada’s northern archipelago is seeing warm air sweep northward. The pattern has been continuous since October. On Alaska’s North Slope average temperatures are 2 Celsius (3.6 Fahrenheit) above records previously set in 1998.
The October warmth which was considered unusual is now being matched by even greater warmth in November during the season of darkness. Some areas of the Arctic Ocean are experiencing temperatures 14 Celsius (25 Fahrenheit) higher than normal.
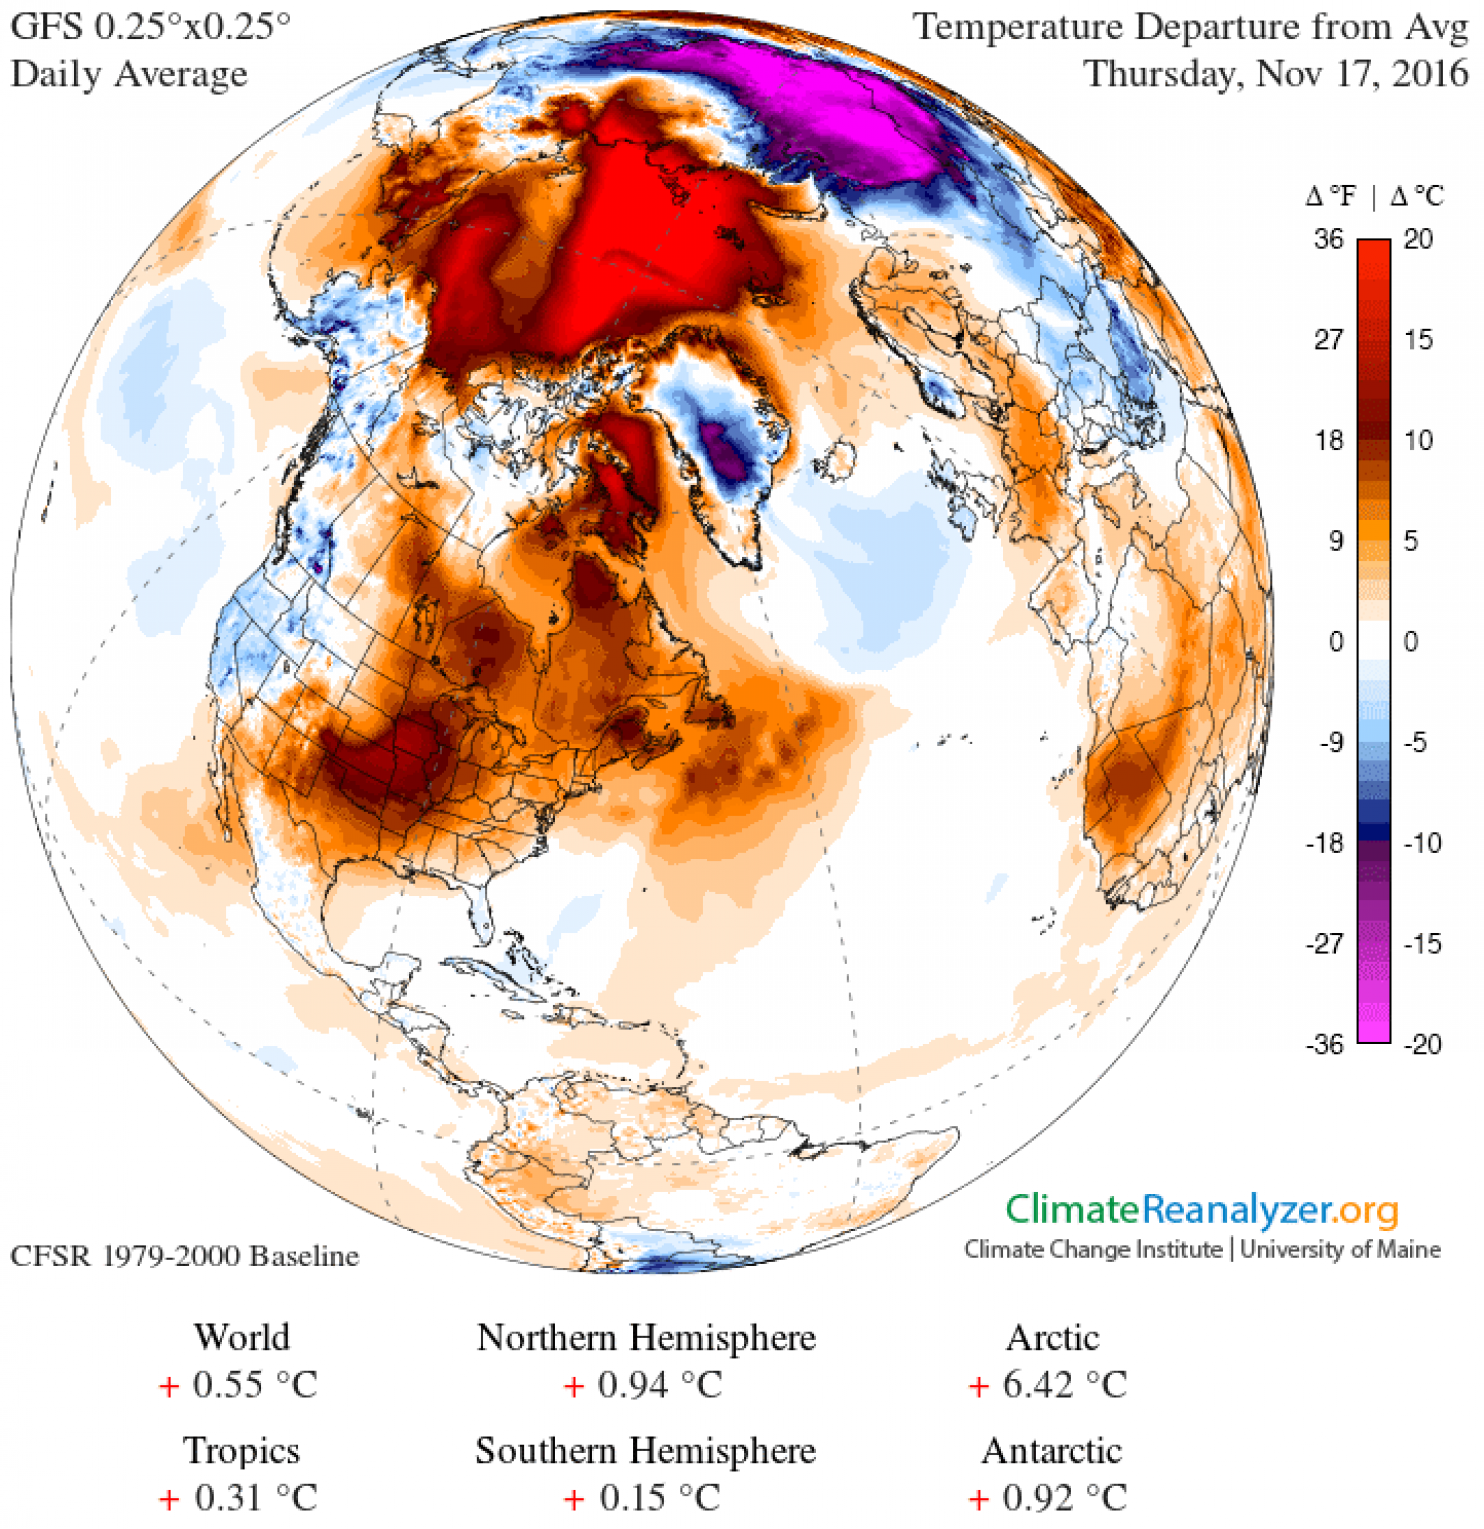
The University of Maine has created a global view of the wacky weather we are experiencing in the Northern Hemisphere. The image below shows temperature departures from the norm for Thursday, November 17. The scale on the right displays the delta from the daily average. Note the amount of red over the Arctic Ocean and the purple over Siberia, two very different extremes.
The weirdness may continue because the longer it takes for the sea ice to reform the more likely temperatures will stay well above normal. This could set up the Arctic in 2017 to sea even more spectacular drops in sea ice coverage. Of course we could see the whole thing reverse but the trending is pointing to a very different scenario of increasing warmth and diminishing sea ice down 7.4% per decade since 1980.
For those of you in eastern North America wondering what that will mean for our winter. The El Nino is no longer a factor this year so the warm and dry winter that the Great Lakes experienced is probably not going to happen. In February last winter we saw what a wobbly jet stream does drawing down a fearsome blast of Arctic cold to the northeast. Climate projections suggest we may see a repeat of these polar vortices this winter with pulses of cold air similar to what Siberia is currently experiencing.
One of the indicators of a warming atmosphere is that weird becomes the new normal.
Related articles across the web


Related Posts
 What Is a Weather Whiplash Event?
 Was Carl von Clausewitz Right Describing War as a Form of Policy?
 If You Are Using Semaglutide Drugs to Lose Weight Are You Hooked on Them for Life?
 Banana Monoculture Is At Risk Without GMO
 Progress and Setbacks on the EV Front – Part 2: Is Battery Range Anxiety Coming To An End?
 Will We Soon Have a Cholesterol Vaccine?
 Conversations About AI: Three AIs Explain Russia’s Invasion Of Ukraine
 Decarbonization Conversations: Using Seaweed to Store Carbon on The Ocean Floor


Since satellite records started in 1958, High Arctic temperatures have been rising due to GHGs being dumped into the bio-sphere. Actual High Arctic temperatures WITHOUT GHG effects are lower than the so-called “average” temperature line. So present conditions are actually worse than the graph indicates. More threatening than the wild excursions above the “average” line are the even more wild time leaps above the “average”. Two plus years ago, High Arctic temperatures never saw an “average” temperature for 140 straight days. At the end of 2015 into 2016, High Arctic temperatures never were “average” for 150 straight days. For 100 straight days in that period, temperatures were ALWAYS over 3degC over “average”(no misprint) & sometimes as high as 11degC over “average”. The present over “average” temperature has been going for nearly 70 days with the wild temperature jumps, now 19degC above “average”. Indeed, this period has become the High Arctic Berserker, that may hit 3 digits of over- “average” days & may go to 150+ days. Even if High Arctic temperatures do return to “average”, they won’t stay, but will soar again. Regular “average” temperatures in the High Arctic seldom exist, except for the summer, when the sun is at its highest elevations. Between the months of ~ late August to late April, when the sun is weak & is low on or below the horizon, excess AGW energy from the south, flows into the Arctic, invigorating the High Arctic Berserker.
“Since satellite records started in 1958,…”
Please, enlighten us … what satellite records start in 1958?
“… High Arctic temperatures have been rising due to GHGs being dumped into the bio-sphere”
Please, show us exactly how … or even approximately how … GHGs being dumped into the bio-sphere have caused anything at all… anything.
I’m kinda hung up on that phrase, …due to… Ya know, like cause and effect … so, show us how temperatures … anywhere … have been rising due to GHGs. Oh, and show your work.
‘Actual High Arctic temperatures WITHOUT GHG effects are lower than the so-called “average” temperature line.’
What, are you witnessing a second earth, without GHG effects? Where is this doppelgänger earth? …where are these actual High Arctic temperatures recorded?
“… end of 2015 into 2016, High Arctic temperatures never were “average” for 150 straight days. For 100 straight days in that period, temperatures were ALWAYS over 3degC over “average”(no misprint) & sometimes as high as 11degC over “average”.” You’re talking about WEATHER not climate.
Where might we find this “so called average temperature line”?
“…excess AGW energy from the south, flows into the Arctic, invigorating the High Arctic Berserker …”
…what is AGW energy? How does this energy “flow”
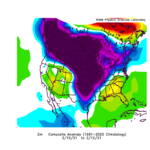
https://uploads.disquscdn.com/images/2ad0190e26ab1ac822a1c93d7d30ddf7d4196579816f6eed82390331120b245f.jpg
Up to August of this year … 2016 … you can see the temperature spikes of the past are not replicated in the data, currently …
Below, you can see Polyakov 2002, clearly showing that the Arctic was warmer in the 1940s era, before Mannkind’s CO2 emissions amounted to more than a hill of beans.
https://uploads.disquscdn.com/images/7409ac03f85f69395bf17e40bd01b5c6a5525ea01d721c2e3468883275e7901b.jpg
Mankind’s hill of beans – an interesting expression for accumulating atmospheric CO2. Explanation of Arctic amplification may have more than one cause but the current trend appears irrefutable.
What is “irrefutable”?
The accumulated data collected and analyzed by scientists around the world.
“”… and a jet stream that no longer acts the way it has in the past…”
Nobody knew of the “jet stream” prior to World War II. American B29 bombers discovered it. With such a short record, nothing can be said about “abnormal”.
http://www.weatheronline.co.uk/reports/wxfacts/The-Discovery-of-the-Jet-Stream.htm
Reid Bryson was one of the first to advise the U.S. military that bombers flying to Japan might encounter strong head winds.
It is absolutely true that the jet stream was a recent discovery but we have collected weather observations over North America for more than a century and a half and jet stream data for more than fifty years and can begin to see correlations.
Many oceanic & wind cycles exceed 60 years, some, 100 years. We can begin to see correlations … with natural variation.
Yang, Lau & Kim 2002: ”Indeed, our understanding of the [East Asian Jet Stream] and its climate linkage is largely limited to the knowledge provided by early studies, which are always restricted by the lack of long-recorded observations.”
Yang, Song, K. M. Lau, and K. M. Kim 2002. “Variations of the East Asian jet stream and Asian-Pacific-American winter climate anomalies.” Journal of Climate
Jacques 2011: ”The Pacific North American mode (PNA) is one of the most prominent modes of low-frequency atmospheric variability in the Northern Hemisphere extratropics (Wallace and Gutzler, 1981). The PNA pattern is associated with strong fluctuations in the strength and location of the East Asian jet stream.”
Woollings, Hannachi, & Hoskins 2010: “Diagnostics of the latitude and speed of the eddy-driven jet stream are compared with conventional diagnostics of the North Atlantic Oscillation (NAO) and the East Atlantic (EA) pattern. This shows that the NAO and the EA both describe combined changes in the latitude and speed of the jet stream. It is therefore necessary, but not always sufficient, to consider both the NAO and the EA in identifying changes in the jet stream.”
Woollings, Tim, Abdel Hannachi, and Brian Hoskins 2010. “Variability of the North Atlantic eddy‐driven jet stream.” Quarterly Journal of the Royal Meteorological Society
Bucha 1998 supported geomagnetic (sun-based) variations in the jet stream: ”In the hypothesis proposed here for explaining Sun-weather relations, downward winds following the geomagnetic storm onset are generated in the polar cap of the thermosphere and penetrate to the stratosphere and troposphere, where the atmospheric response can be observed as a sudden increase of pressure and temperature. … accelerated and strong eastward winds participate in the intensification of the northern jet stream and … It is shown that at a time of low geomagnetic activity planetary waves with large amplitudes prevail in the northern hemisphere … On the other hand, at a time of high geomagnetic activity, an intensification of the winds can be observed not only in the thermosphere but also in the troposphere. A strong northern jet stream participates in the …These relations are clearly detectable not only in monthly averages of the pressure and temperature distribution but also in the daily variations of atmospheric circulation. The results enable us to test a causal link of the Sun-weather processes, to explain strong interannual climate and weather changes in several key regions of the northern hemisphere, mainly in winter, and to study possible causes of the North Atlantic Oscillation.”
Bucha, Václav 1998. “Geomagnetic forcing of changes in climate and in the atmospheric circulation.” Journal of Atmospheric and Solar-Terrestrial Physics
Cold spells over North America are linked to a very zonal and intense Jet Stream, which is preceded by a negative NAO and a positive PNA.
Messori, Gabriele, Rodrigo Caballero, and Marco Gaetan 2016. “On Cold Spells in North America and Storminess in Western Europe.” Geophysical Research Letters
http://climdyn.misu.su.se/publications/pdf/messori.etal.2016.cold.events.pdf