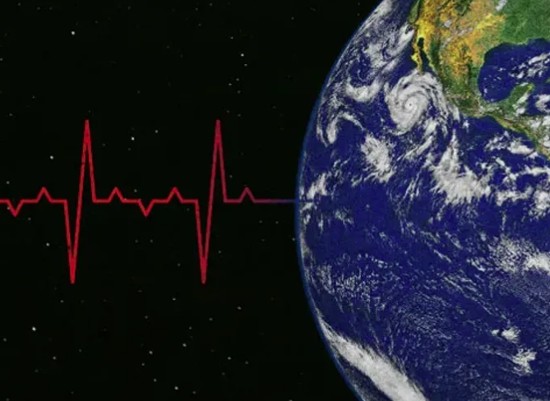
There will be lots of articles on the subject of our annual rite of passage called Earth Day, inaugurated on April 22, 1970. In this posting, we take a measure of where we were then (1970), and where we are now (2023).
Until COVID-19 came along and doctors stopped seeing patients face-to-face, when we wanted a measure of the state of our wellness we would undergo a physical examination. Our doctor would listen to our heart, and lungs, look in our ears, check our reflexes, blood pressure, weight and height and compare observations with those from the past. Our doctor would order bloodwork, and maybe an electrocardiogram (ECG).
The Earth doesn’t go through the same type of physical. Scientists, however, for much of the 20th and 21st centuries have been taking measurements that look at air and ocean temperatures and chemistry, and sea and land ice levels to get an up-to-date picture of the planet’s well-being.
Measuring Atmospheric Temperatures
Trying to find out what the global average temperature was back in 1970 should be an easy task, but it isn’t because there is no single definitive source for this data. So to get my bearings on the subject I looked at American, United Nations, and European Union resources.
It turns out that the most definitive sites are those coming from the U.S. government. The website of America’s National Oceanic and Atmospheric Administration (NOAA), Climate.gov, is a good resource to take a measure of Earth’s current and past temperatures. It states that Earth’s recorded average temperatures have risen 0.08 Celsius (0.14 Fahrenheit) per decade since 1880, amounting to an increase of 1.1 Celsius (2 Fahrenheit) in total over 143 years. It also notes that since 1981, the rate of warming has increased amounting to a 0.18 Celsius (0.32 Fahrenheit) rise per decade. Our average global temperature in the 20th century was 13.9 Celsius (57 Fahrenheit). In 2022, that average rose to 14.76 Celsius (58.55 Fahrenheit) with the ten warmest years occurring since 2010.
Data from NASA shows that 1970 wasn’t a particularly warm year consistent with much of the mid-20th century which scientists believe was caused by the increase in industrial aerosol emissions after World War Two. But since 1970, the first Earth Day year, the average global temperature has been rising to reach 0.89 Celsius (1.6 Fahrenheit) higher over continental land masses and 0.9 Celsius (1.62 Fahrenheit) and the world’s oceans. (I’m sure conspiracy theorists would point to the coincidence of the first Earth Day and global warming and suggest a plot by scientists and the government to make us give up our cars.)
Measuring Atmospheric Chemistry
Another way to measure the planet’s health on Earth Day is to look at atmospheric carbon dioxide (CO2) and other greenhouse gas (GHG) emissions associated with human activity. NOAA tracks CO2 levels at its observatory on the top of Mauna Loa in Hawaii. In 1970, atmospheric CO2 levels measured in parts per million (ppm) amounted to 325.68. In 2022, that number had increased to 418.56 ppm. Current monthly average readings to the end of March 2023 are 421 ppm. That’s an increase in CO2 edging towards 30% in a mere 53 years.
Another measure of the planet’s health is levels of methane (CH4), a potent GHG that has both natural and human industrial origins. NOAA has been measuring CH4 levels in the atmosphere since 1983 through a global network of air sampling sites. CH4 is measured in atmospheric parts per billion (ppb). The split between natural and human CH4 is 40/60 with scientists assigning 30% of the rise in global average temperatures since the mid-19th century attributed to its increasing presence which in 2022 varied between 2023 and 1925 ppb as gathered from marine observatory sources. That’s up from CH4 levels between 1984 and 1626 ppb in 1983.
On average CH4 levels have risen from 700 ppb in 1850 to an average of 1,974 ppb in 2022, an increase of 282% since the start of the Industrial Revolution. The CH4 cycle of highs and lows is dependent on seasonal agriculture sources such as rice fields and burning biomass as well as industrial emissions combined with the atmospheric reaction of this gas which degrades far more rapidly than CO2.
Other GHGs that in recent years are being measured at Mauna Loa include nitrous oxide (N20), and sulphur hexafluoride (SF6) which are both trending upward.
In part 2 of this health checkup for the planet, we will look at what is happening to our planetary ocean and sea and land ice.


[…] the last Earth Day posting on this blog site, the state of the atmosphere’s health was examined. But a health checkup for the planet that doesn’t look at the state of water […]