February 5, 2020 – The same climate models that have been used by scientists for the last half-century to accurately project our climate future are suddenly turning up the heat and the general consensus is we don’t know why.
These are the models that underly the Intergovernmental Panel on Climate Change (IPCC) annual reports. They have been inherently accurate in predicting temperature rise and changing climate conditions across the planet. But now the climate scientists are seeing projections that are causing consternation. If accurate, then the world is heating up faster and that is pretty disturbing news considering how slow governments have been to react to anthropogenic climate change.
The predictions if right point to a smaller window of opportunity for us to reverse the direction we are going. In an article appearing in Bloomberg Green yesterday, it states, “Policy makers and members of the public are turning to scientists as never before to explain historic wildfires, devastating droughts and spring-like temperatures in mid-winter. And the bedrock of the science has never been more solid. But the questions vexing experts now are probably the most important of all: Just how bad is it going to get—and how soon?”
One of the climate modelers, Klaus Wyser, Senior Researcher at the Swedish Meteorological and Hydrological Institute, noted that he is seeing projections of warming of 4.3 Celsius (7.7 Fahrenheit), a 30% jump over previous predictions and is hoping it is not the right answer.
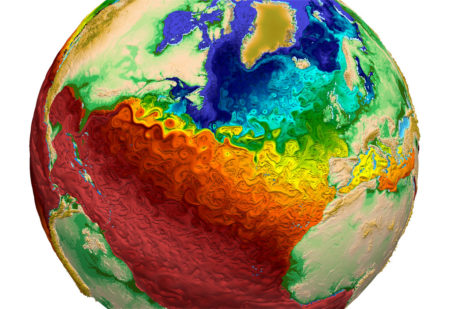
To understand why these new results are so disturbing requires us to take a peek inside the world of climate modeling. The first step is to do a lot of historic data gathering to get an accurate picture of the climate, including air, land, and sea, in the 20th century. All this data gets crunched on supercomputers. From this, the researchers can build 20th-century models that parallel real-world data. This then becomes the starting point for predicting the future.
There are more than 300 digital Earths today analyzing climate data and predicting our future. And until the last year doing it with crystal-clear accuracy. Then last year one of the longest-running models developed by the U.S. National Center for Atmospheric Research (NCAR) started spewing some pretty strange results. When the model was fed an increase in carbon dioxide (CO2) to double pre-Industrial Revolution levels by century end, instead of a 3 Celsius (5.4 Fahrenheit) rise, it showed 5.3 Celsius (over 9.5 Fahrenheit). That’s a global mean average. If accurate, imagine what that would mean for polar regions where warming is happening at twice the pace of temperate latitudes.
And the NCAR prediction wasn’t the worst. New climate modeling numbers from the United Kingdom predicted warming of 5.5 Celsius (9.9 Fahrenheit), and Canada’s numbers topped 5.6 (over 10 Fahrenheit). In fact, 20% of newly published climate modeling results showed anomalously higher numbers than the 3.0 Celsius that was previously the consensus in IPCC annual reports. Not all climate models have yet to publish data from the last year. But if the overwhelming majority are in agreement that the 3.0 Celsius number is wrong, then the response of governments from around the world who have relied on IPCC guidance to implement carbon policy and net-zero strategies will have to work to a new and shorter timetable. And that means the goal of the Paris Climate Agreement to limit the rise to 1.5 Celsius (2.4 Fahrenheit) by century end is already unattainable.
Considering that it is 2020 and the atmosphere of our planet has already seen a mean temperature rise of 1.0 Celsius (1.8 Fahrenheit), we are two-thirds of the way to the Paris limit with many governments still talking about what to do, and keeping citizens in the dark about how lifestyle in the Developed World will have to accommodate to the changing environment while helping the Developing World to withstand the worst that global warming will offer.


