In what is described as a “code red” moment for the planet, the publication of the latest climate change assessment is flashing red and presenting governments around the world with likely outcomes in this century.
In this second summary of my read of the IPCC Summary for Policymakers report, we review five climates outcomes this century as described in the document.
Scenario 1
In the first climate outcome, the report looks at the consequences from greenhouse gas (GHG) emissions retained in the atmosphere, plus those added throughout the remainder of the century. A doubling in carbon dioxide (CO2), methane (CH4), and nitrous oxide (N2O) levels from the mid-century to 2100 and beyond is highly likely even with mitigation efforts such as the application of net negative CO2 reduction technologies and the expansion of natural carbon sinks on land and in the ocean.
Under these circumstances, global surface temperatures will continue to rise exceeding 2.0 Celsius (3.6 Fahrenheit) by 2100. Note, that was the upper limit of the Paris Climate Agreement’s agreed-to temperature constraint.
If new emissions, however, remain lower then temperatures may rise no higher than 1 to 1.8 Celsius (1.8 to 3.2 Fahrenheit). But if not contained and increase the outcome could see a rise between 3.3 to 5.7 Celsius (5.9 to 10.2 Fahrenheit) over mean temperatures from the years between 1850 and 1900. The Earth’s atmosphere would be akin to what was experienced 3 million years ago during a significant warming period.
Scenario 2
This outcome looks at the frequency of heat extremes on land and in the oceans, heavy precipitation and tropical cyclone events, agricultural and ecological droughts, and reductions in permafrost, sea ice and snow cover with every additional 0.5 Celsius rise increasing intensity and duration.
Mid-latitude and semi-arid regions will see the highest peak land temperatures averaging 1.5 to 2 times more hot days. And the Arctic will see a 3-times increase in temperatures for its coldest days. Both the tropical and polar oceans will see increases in the frequency of marine heatwaves.
Extreme precipitation events will be more frequent with increases in intensity by 7% for each 1 Celsius (1.8 Fahrenheit) degree of warming. Add to this an increasing intensity in tropical cyclones with peak winds registering at Category 4 and 5 levels.
Permafrost thaw, seasonal snow cover, and land ice in the Arctic will be impacted with the Arctic Ocean being practically ice-free in September at least once before the year 2050.
Scenario 3
This outcome looks at the vulnerability to global warming of the atmosphere’s water cycle. Average annual land precipitation is projected to increase by up to 5% from the present if we can keep new emissions low., but up to 8% under the median emissions in Scenario 1, and 13% under high emissions. These projections are for the period at the end of this century.
Precipitation is expected to increase more in high latitudes, the equatorial Pacific and parts of monsoon regions, but decrease in parts of the subtropics and tropics.
Changes in season intensity are projected as global atmospheric temperature rise causes changes to regional atmospheric circulation. The annual monsoon, a seasonal event is expected to be delayed.
The southern hemisphere will see a poleward shift of mid-latitude storms. The northern hemisphere storm tracks are likely to remain unchanged although the intensity and frequency of the storms as stated in Scenario 2 will increase.
Scenario 4
This outcome concerns the effectiveness of natural carbon sinks on land and in the ocean where increased CO2 emissions in the atmosphere will lead to less effective sequestering of the greenhouse gas. What that means is more CO2 will remain in the atmosphere contributing to increased warming. The rate of CO2 uptake by these natural sinks is expected to decrease in the second half of the century.
Could the natural carbon sinks become CO2 contributors as the century unfolds, accelerating atmospheric warming? Based on the data in this report, it is deemed unlikely to happen before 2100. What is uncertain at present is just how much CO2 will find its way into the atmosphere by the turn of the next century. The impact of higher amounts of greenhouse gasses on ecosystems is not yet fully understood. And the current climate models are still weak in understanding CO2 and CH4 emission contributions from wetlands, permafrost thaw and wildfires, all expected to increase through the century.
Scenario 5
This outcome notes that past and future greenhouse gas emissions will be irreversible for centuries to millennia. Where will the impacts be greatest? On the world ocean, polar and mountain glaciers, and on sea levels.
Over the rest of this century ocean warming will be up to 8 times faster than the recent period between 1971 and 2018. The upper ocean, that is, the surface water will be most impacted although warming will find its way throughout the entire water column because of the natural conveyor belt that brings water from the depths to the surface and then down again.
Ocean water will become more acidic and deoxygenation is expected to increase as the century progresses. Atmospheric CO2 volumes will govern the rate of both acidification and deoxygenation. Both conditions will have a profound impact on ocean ecosystems with the changes described as irreversible for at least a century to millennia.
Mountain and polar glaciers will continue their current melting for centuries to come. Permafrost thaw is seen as irreversible. Both the Greenland and Antarctic ice sheets will be impacted either slower or faster based on the volume of greenhouse gasses still being emitted from human sources let alone from reversing natural carbon sinks as the century unfolds.
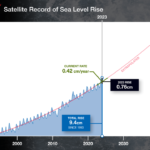
Sea levels will rise throughout the 21st century with the likely global mean increase by 2100 at between 0.28 and 0.55 metres (0.9 to 1.8 feet) under lower emissions, 0.32 to 0.62 metres (1 to 2 feet) under intermediate emission rises, and between 0.63 and 1.01 metres (2 to 3 feet) if emissions remain high. These estimates do not include the uncertainties that could manifest from sudden ice sheet melting events, particularly in Antarctica.
The report notes that longer-term sea-level rise is expected for centuries to millennia because of overall ocean warming and ice sheet melt. The prediction, if warming is limited to between 1.5 and 2 Celsius (2.7 and 3.6 Fahrenheit) will be a 2 to 6-metre (6.5 to 19.6-foot) rise in the next 2,000 years. And if temperatures rise by 5 Celsius (9 Fahrenheit), the rise will be 19 to 22 metres (62 to 72 feet) over millennia.
These projections are consistent with reconstructed sea levels from paleoclimates. For example 125,000 years ago, when global temperatures were between 0.5 and 1.5 Celsius (0.9 to 2.7 Fahrenheit) warmer, sea levels were 5 to 10 metres (16 to 32 feet) higher. And 3 million years ago when global temperatures were 2.5 to 4 Celsius (4.5 to 7.2 Fahrenheit) higher, sea level rise was as much as 25 metres (82 feet).
Summing Up
No person living today should look at these findings with skepticism. The data collected, based on hard evidence when fed into numerous climate models, point to these outcomes within the variations and ranges described.
We will continue to look at the IPCC report in our next posting when we cover what the document states about risk and adaptation, as well as how to limit future climate change. We know the answer already but it bears being repeated.


