January 21, 2018 – For the past two-and-a-half days I have been resting my knee after receiving a cortisone treatment. You see if you start moving around too early the cortisone tends to migrate from the targeted area in your body and loses its effectiveness. Finally today I am up and about and feeling good enough to walk a few kilometers with my dog.
I haven’t been totally idle while remaining with my leg elevated. Instead, I have been catching up on my reading about our changing climate, the mystery surrounding the SpaceX Zuma mission, the latest non-science bashing genetically modified organisms, and, of course, Donald Trump.
One study that caught my eye comes from NASA, the agency that the current administration wants to stop looking at the Earth and instead look to the Moon and Mars. NASA’s Earth science portfolio is very deep. Satellites it has launched study greenhouse gas levels in the atmosphere, the state of our oceans and continents, weather and climate, land use, deforestation, and more.
The latest from NASA to be published is a study of atmospheric methane (CH4), a greenhouse gas that doesn’t endure in the atmosphere as long as carbon dioxide (CO2), but nonetheless, contributes to global warming. And CH4 has increased in the atmosphere at a rate of 25 teragrams annually since 2006.
What’s a teragram? One is equivalent to 1 million metric tons (1.2 million American tons). So CH4 emissions have been accumulating at a rate of 25 million metric tons each year for more than a decade. When compared to CO2 accumulations over the same period 25 million tons is a blip. That’s because CO2 contributions amount to more than 25 gigatons annually and a gigaton equals a billion metric tons. That latter contribution accounts for 82% of all greenhouse gas emissions produced from human activities.
So why worry about 25 million tons of CH4?
Here is an interesting statistic. Although CH4 contributes a mere 1% of the amount of greenhouse gases entering the atmosphere, that small percentage translates to 9% when weighing the total impact the gas has on global atmospheric warming. In other words, CH$ has a nine times greater impact per ton than CO2.
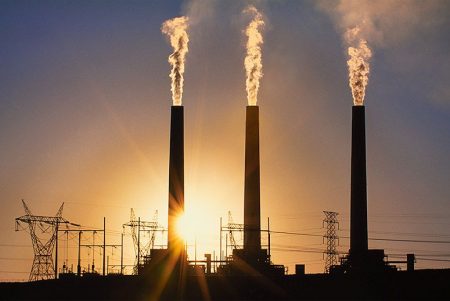
CH4 comes from many sources; wetlands, swamps, mangroves, tidal ponds, Arctic permafrost, fossil subsoils, underground natural gas reservoirs, the digestive tracts of ruminants (cows), and from fermented manure used as fertilizer on farms. It also is a common byproduct of forest fires like those that have stricken parts of Southern California in the last two months.
The signature of CH4 from every source can be isotopically isolated. So we know the difference between CH4 from cow farts and CH4 from a gas wellhead. This gives NASA scientists the ability to accurately measure origins which they do using satellite and ground-based imaging spectrometry. The collected data shows that the observed global rise in atmospheric CH4 is largely attributable to oil and gas exploration, production, and distribution. Of the 25 teragrams of CH4 being added to the atmosphere annually, NASA data indicates that 17 is derived from oil and gas.
Should we be worried?
If we continue to expand oil and gas exploration as is evident in the policies of the current Trump government in the United States, then indeed we have a problem.
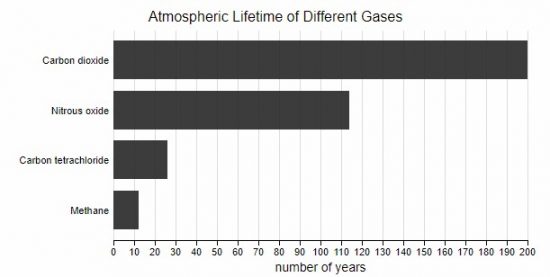
Surprisingly, the study doesn’t include data about CH4 short atmospheric life. When compared to CO2, CH4 hangs around as a greenhouse gas for 12 years before it breaks down through natural processes, whereas CO2 hangs around for up to 200 years if not trapped in natural sinks or by human-created carbon sequestration technologies that have yet to exist.
Scientists describe CH4’s warming as short and sharp while attributing words like “creeping” and “insidious” when talking about increasing CO2 in the atmosphere.
Contributors, other than NASA to this study, include the National Center for Atmospheric Research, Boulder, Colorado, the Netherlands Institute for Space Research, and the University of Utrecht, also in The Netherlands.
Related Posts
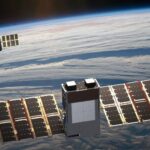 High Speed Internet Coming to Space
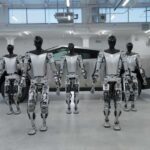 Robots in the News: From Tesla Optimus to BMW Figure and More
 Virtual and Augmented Reality Update: Apple Vision Pro and the Metaverse
 Study Shows Canada and Other Countries Unprepared for Cyberthreats
 Was Carl von Clausewitz Right Describing War as a Form of Policy?
 Can Planets Exist Without a Star?
 Earth Day 2024 And The Atmosphere Is Raining Microplastic
 Investing In Space Ventures Is Hot Right Now


