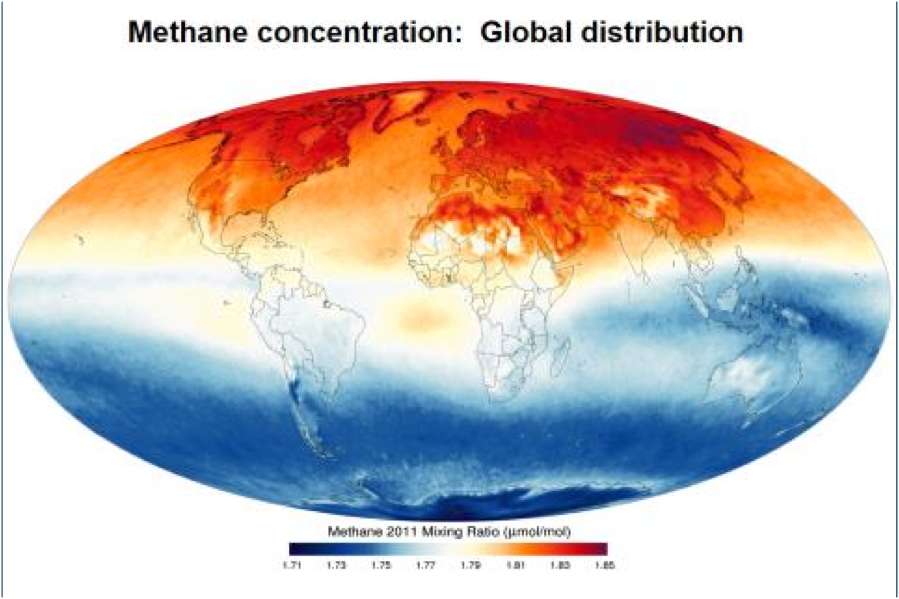
February 25, 2014 – We know today that CO2 is reaching the threshold of 400 parts per million in our atmosphere. We are told that this component of greenhouse gas emissions (GHGs) is the main measure fcr determining human influenced climate change. There are, however, other potent GHGs. One is methane (CH4) and like CO2 it also is studied.
Anthropogenic (that is human produced) methane comes from many sources. These include the mining and burning of fossil fuels, farming, and gases emitted by garbage at landfill sites. It is estimated that 60% of all methane in our atmosphere is derived from human activities.
Methane tends to dissipate much faster than CO2. An average molecule lasts eight to nine years before it oxidizes. That makes methane harder to measure and that’s why methane tends to be measured at the source rather than the way we measure CO2. But are we accurate in our measure? And do we truly understand methane’s contribution to global warming?
The Environmental Protection Agency (EPA) of the United States, which calculates the amount of methane released through human activity, is being called on the carpet by a recent university study that appeared in a November 2013 issue of the Proceedings of the National Academy of Sciences. It appears that the EPA has seriously underestimated the amount of methane released through human activity in the United States. In fact total amounts appear to be between 1.5 and 1.7 times higher than EPA figures.
The miscalculation may be the result of different methods used to collect data on the GHG. The study summarily dismisses EPA data and that provided by the European Commission’s Emissions Database for Global Atmospheric Research, known in short as EDGAR. The data the EPA and EDGAR provide look at source emitters of methane. For example they have a calculation for the average yield of methane from rumination per head of cattle, or the average amount of aerated gas from oil and natural gas wellheads, or the amount emitted from coal mine operations or landfill sites. The study results do not approach the measure of methane this way. Instead the approach is top down, measuring the total concentration of methane in the atmosphere in similar fashion to how we measure CO2. But because methane oxidizes in a short period of time the amounts vary by year considerably.
If both U.S. and European oversight have got it wrong, what about the rest of us studying methane on the planet? What other countries and continents are taking measure of methane output? How consistent is the methodology?
Well it appears that some countries are very much aware of the methane contribution of their dairy and non-dairy cattle. Some are measuring methane output as well from pig farms. Others are measuring methane from fracking wellheads. Some are collecting methane captured from landfill sites. But it appears the measure of methane seems largely dependent on national or institutional preference.
How about the remaining 40% that is not human produced? Most of that methane comes from plant decay from natural wetlands. But even more of the gas is trapped in permanently frozen soils in the sub-arctic of Canada, Alaska and Siberia. This permafrost may not be so permanent after all. Trending to more significant warming in the Arctic may eventually lead to significant amounts of methane release over the coming decades. And although methane does not have the staying power of CO2 it will further destabilize our climate.
The global community, therefore, needs to understand just how much methane we humans are producing and find ways to lessen those amounts. We know that methane has increased in the industrial age. We know this increase is anthropogenic. And we know there are ways we can reduce methane release. Some of these are:
- Breeding new varieties of cattle and dairy herds that emit less methane gas.
- Similarly creating less methane producing pigs.
- Capturing methane gas from fracking sites rather than trying to consume the gas through flaring it off at the wellhead.
Addressing the natural release from permafrost, however, is a much tougher assignment for which there appear to be no easy solutions. And if we should start mining methane hydrates from the ocean floor we could be opening a Pandora’s Box.
Related articles across the web


Related Posts
 Public, Court Interventions and Climate Change
 How The Rise Of AI Is Shaping The Future Of Business
 When Will We Be Able To Regenerate Ourselves or Worse Create Chimeras?
 Will We Soon Have a Cholesterol Vaccine?
 Another Potential Battery Breakthrough That Uses A Water Electrolyte
 Will AI Disrupt the Practice of Medicine? Absolutely
 Solar Energy is Popping Up in Some Very Unusual Places
 Can Kinetic Energy Harvested From Human Activity Help Save The Planet?


How is green house gas strength or if you will “Activity” measured? Specifically, just a very few years ago, what appeared to be the accepted oft-published green house gas “activity” relative to CO2 was 5 times more active. Then, just in this past year, I have seen this relative number rapidly rise from 5 to 20 to 50 times as “active” as CO2. At least one very recent publication that purports to know how much more active of a GHG than CO2 estimates it at a factor of 34. Now folks, this is a HUGE difference in relative GHG strength to CO2 and will have a great impact on what ever calculations one makes with it. So what is CH4’s relative GHG strength to CO2? Is it 5, 20, 34 or 50? I’ve searched the internet for an answer as to how GHG “activity” is measured and what the real number is and I can’t find a thing. Are those who write the articles and in the media, for lack of something better, just choosing a number that they like and best supports their “position” on climate change?
Here we are, poised to completely take down the United States middle class livelihood using information and numbers that is so divergent, that the largess of have to be completely wrong.
Come on American media, if we can’t do better than the obvious junk put out on methane’s GHG activity, how in the world can we think we have anywhere near the correct scientifically objective conclusions?
From a study published in Nature in 1990 the authors proposed an index of global warming potential for methane, carbon monoxide, nitrous oxide, CFCs and CO2. Methane was described has having a global warming potential per mole, 3.7 times that of CO2. The research indicated that in the period of the study from 1980 to 1990 these gases were responsible for 43% of increased radiative force within the atmosphere but were present in concentrations 2 to 6 orders of magnitude less than CO2. So methane, carbon monoxide, nitrous oxide, and CFCs are stronger absorbers of infrared radiation than CO2 even though the latter is the major contributor to global warming at a ratio of 4:1 – CO2 to trace gases. In 1990 that amounted to 57% of the increased radiative forces in the atmosphere during the 1980s. Of course, since this study CO2 concentrations have increased from 340 ppm to 400 ppm. I don’t have the numbers for increases in methane from industrial activity and permafrost melt for the same period but in any case methane oxidizes in about a decade so its impact is more transient than permanent.
The study which provided the data on trace gas contributions versus CO2 is by Daniel Lashof and Dilip Ahuja, entitled “Relative contributions of greenhouse gas emissions to global warming.” It appeared in “Letters to Nature,” Volume 344, pages 529-531 on April 5, 1990.
An explanation on radiative forces – MIT News back in March 2010 provided a terrific explanation in a two-part series on greenhouse gases and climate change. You can read the entry at http://newsoffice.mit.edu/2010/explained-radforce-0309.