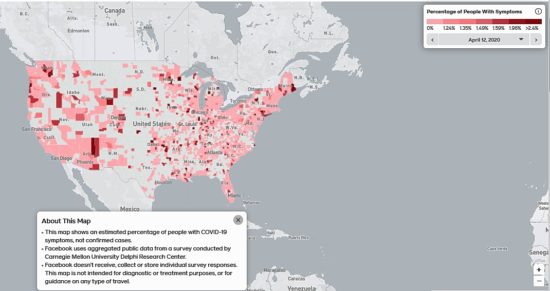
April 23, 2020 – With a lack of widespread testing for COVID-19 infections in the United States, social networks can provide aggregated data based on online surveys of those who are members. In the map seen below, Carnegie Mellon University’s Delphi Research Center and Facebook have combined their efforts in cooperation with the Centers for Disease Control and Prevention (CDC) to map people’s responses.
In choosing Facebook as the medium for gathering COVID-19 research data, the University was able to get a million people responding over a 2-week period. Responders were asked to self-report symptoms of the flu or the coronavirus for themselves or people living with them from the previous 24-hour period. Each day a sample was gathered from different users age 18 or over within the United States. All results were given a weighted value to correct for sample bias. The results don’t represent actual COVID-19 cases but do suggest that the virus may be far more widely distributed than the current number of cases being reported.
As of the writing of this posting, the U.S. has reported more than 852,000 cases and over 47,000 deaths. Testing per million is averaging just over 13,000 and the total number of tests done to date is just over 4.35 million representing 1.3% of the country’s total population. Recognizing the paucity of testing, a survey like this one fills in a gap.
That’s not to say that everyone reporting COVID-19 like symptoms is infected. I think so many of us have become paranoid about the signs of the virus that we are beginning to psych ourselves out. Both my wife and I are debating whether we should be tested based on symptoms we are experiencing in the last few days.
The survey is by county, by hospital referral region, and can be separately viewed for COVID-19 or flu symptoms. The image below shows county information with the data collected up until April 12, 2020. Neither the University nor Facebook are keeping or storing individual responses to the survey. All data is aggregated and anonymized.
Earlier this week I posted a COVID-19 antibodies study based on serology tests being done on volunteers in one California county. The results showed a range of between 2.5 and 4% of those tested as having been infected by the virus. The researchers argue that at that level of presence it is likely that there are 50 to 85 times more cases in the general population than what is being reported. It also talked about silent spreaders of the virus, people infected who are asymptomatic or only experiencing mild symptoms.
So does the Facebook-Carnegie Mellon survey fill a missing information gap? Undoubtedly, until testing of the entire population of the United States is done at least once if not several times and until a vaccine can be developed and distributed.


