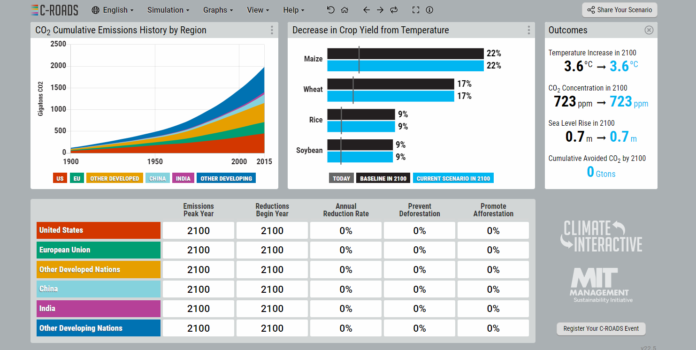
In Part 1 of this series, we looked at the climate simulator En-ROADS. C-ROADs describes itself as a simpler cousin with a primary purpose to give users an understanding of major climate change effects. If you want to see the impacts of increasing carbon dioxide (CO2) emissions, temperature and sea-level changes, reductions in fossil fuel burning, and reforestation, C-ROADS produces a pretty clean-looking picture. It doesn’t have the sliding bars to accompany the graphs that are featured in En-ROADS.
Maybe the “C” stands for classroom and not climate because C-ROADS appears to be a good teaching tool allowing students to play with the various factors contributing to global warming and see impacts in graphical formats that provide regional and hemispheric data representations. The number of variables is far fewer than those found in En-ROADS. And popups in the simulator explain concepts and keywords.
The C-ROADS menu provides a user with the ability to input and reset assumptions to see results, set and reset policies, and then view the results graphically with three different displays: a global view, and a three and six region view.
Graphs can display greenhouse gas (GHG), and CO2 emissions by type and region. Land use options look at forestry emissions, carbon removal from afforestation and other sources. Population, gross world product and gross domestic product (GDP) can be viewed by region and per capita.
Users can view various impact scenarios over time throughout the 21st century looking at CO2, methane (CH4), GHGs, temperature, sea level and flood risks to population and geography, ocean acidification, Arctic ice, crop yield changes (see the graph in the image at the top of this article), species loss, and additional deaths from extreme heat.
Why use C-ROADS rather than En-ROADS? Because of its simplicity. Where policymakers will find the latter a better tool, the public and students can get their feet wet using C-ROADS as their climate simulator. C-ROADS is designed to build a shared understanding of climate dynamics without being a specialist.
In a review of C-ROADS it cites why the climate simulator produces the kind of information that is useful to non-specialists and the public while still adhering to scientific rigour.
It features:
- state-of-the-art climate models.
- tracks all the GHGs that influence global warming.
- identifies from where emissions come from burning fossil fuels, to forestry and land use.
- provides business-as-usual scenarios.
- reports changes in all significant climate change categories.
Any changes made by model users are immediately updated.
C-ROADS limitations cannot break down data to a very small scale. It omits the costs assigned to policy actions as well as climate change damage. Because of these and other limitations, En-ROADs was developed.
Both simulators in the end provide interactive, transparent, and fully documented information to build an understanding of climate change based on the best available science.


