Ellie Morgan, Digital PR Executive at Evolved Research in the United Kingdom has sent me some interesting data accumulated by a car leasing source in her country comparing internal combustion engine vehicles (ICE) with battery electric vehicles (BEVs), and plug-in hybrids. The following is a summary of the report she shared with me.
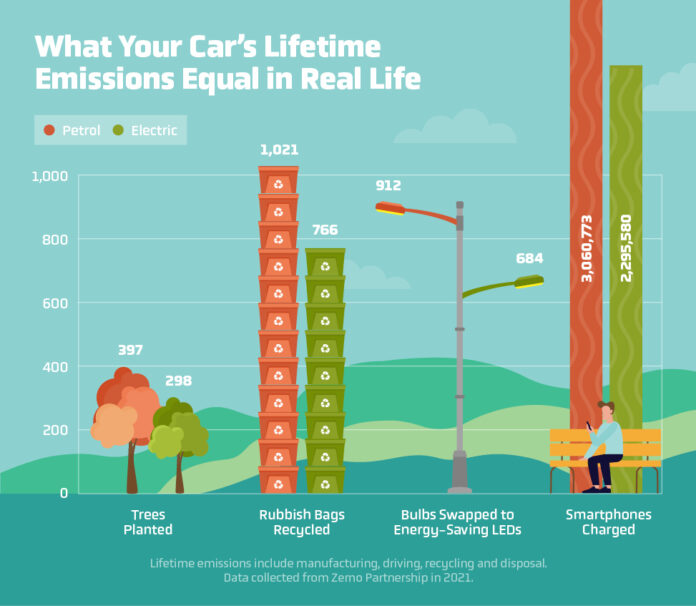
A comparison of CO2 emissions from 100 ICE (gasoline and diesel) and 100 hybrid, plug-in, and battery electric vehicles (EVs) show the carbon footprint differences among them, from how many trees you would need to plant to how many smartphone charges would equal the offset to the emissions produced by these different types of vehicles.
Key Findings:
- ICE cars emit 7x more emissions than EVs.
- You’d need to plant 25 trees in a year if you use an ICE car to offset its annual greenhouse gas emissions. With an EV you’d only need to plant 3.
- An ICE car’s life cycle produces emissions equal to 3 million smartphones.
- Driving an ICE car for a year is equal to the emissions generated from 63 garbage bags going into a landfill. For a BEV, the number is 0.
- 912 bulbs would need to be swapped to energy-saving LEDs to offset the greenhouse gas emissions an ICE vehicle produces over a lifetime.
How did Moneyshake come up with their comparison? They compiled data from registrations of ICE vehicles and EVs from 2015-2020 UK Department for Transport statistics and then picked the 10 most popular models for each type. They then collected CO2 data about each vehicle from the European Environment Agency, and did the analysis to create an emissions average for each and for the total.
In the UK, the average vehicle mileage amounted to just under 12,000 kilometers (7,400 miles) annually. Using that number they calculated the net annual CO2 emissions produced in grams per kilometer using the
Greenhouse Gas Equivalencies Calculator.
Of those vehicles in the report, the Volkswagon Golf turned out to be the largest CO2 emitter at 165 grams per kilometer. The lowest emitting vehicles were all BEVs including the Nissan Leaf, BMW i3, Renault Zoe, and three Tesla models (the S, E, and X).
The report also looked at driver perceptions noting that one in four don’t believe EVs are more environmentally friendly than driving ICE vehicles. Why?
Because drivers of both fossil-fuel powered and electric cars don’t just look at the emissions produced while driving. They consider emissions during the full-life cycle of the vehicle including manufacturing, maintenance, recycling, and disposal of materials. BEVs produce no emissions running them, but almost half of their carbon footprint is generated during manufacturing.
According to a separate
report produced by Zemo Partnership, in the end ICE vehicles produce around 24 tons of CO2 during their entire lifecycle while EVs produce 25% less.
For British drivers who face a 2030 government deadline to phaseout ICE-powered vehicles, there will be no choice but to move to EVs. So if you’re having doubts about their eco-friendliness,
the Moneyshake report has crunched the numbers so you can begin to compare the ICE vehicle you are driving now to what lies ahead when you go to purchase or lease your next car or truck.


