May 6, 2014 – This week the U.S. Global Change Research Program issued its latest National Climate Assessment. This program consists of a scientific panel of 300 experts supervised by a 60-member committee advisory committee with input from the public, industry, federal agencies and the National Academy of Sciences.
What are its conclusions?
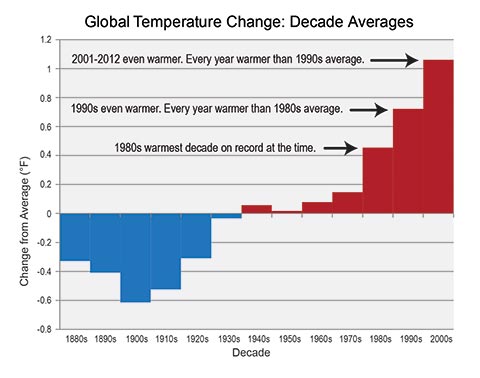
- the climate of the United States is changing based on a wide range of observational data and that the change of the last 50 years correlates with human activity and particularly with the burning of fossil fuels. The chart below maps the average temperature change by decade. Figures are supplied by the National Oceanic and Atmospheric Administration (NOAA).
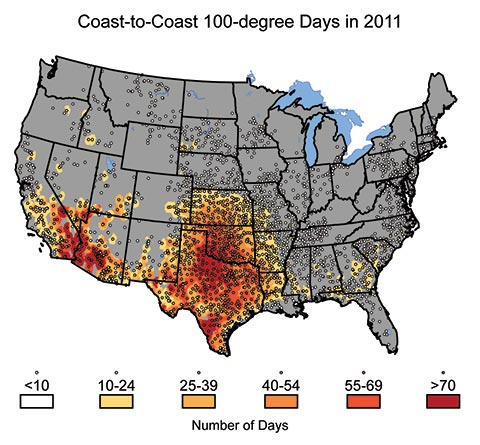
- Extreme weather events including heat waves, droughts, heavy downpours and severe flooding are on the increase over the last 50 years. The map below shows the number of days in which daytime high temperatures have risen above 37.77 Celsius (100 Fahrenheit) degrees. Data from 2011 has been plotted from NOAA gathered statistics. 2012 continued the trend with the Midwest setting record high monthly average temperatures. The first and now the second decade of the 21st century have seen the relative number of extreme weather events increase dramatically by a factor of 40 since the 1950s. The mechanism for these extreme weather events is warmer air which absorbs more water vapor which then fuels storm systems and alters the characteristic air flows and weather patterns. Hence floods in one part of the country and drought pervasive in another.
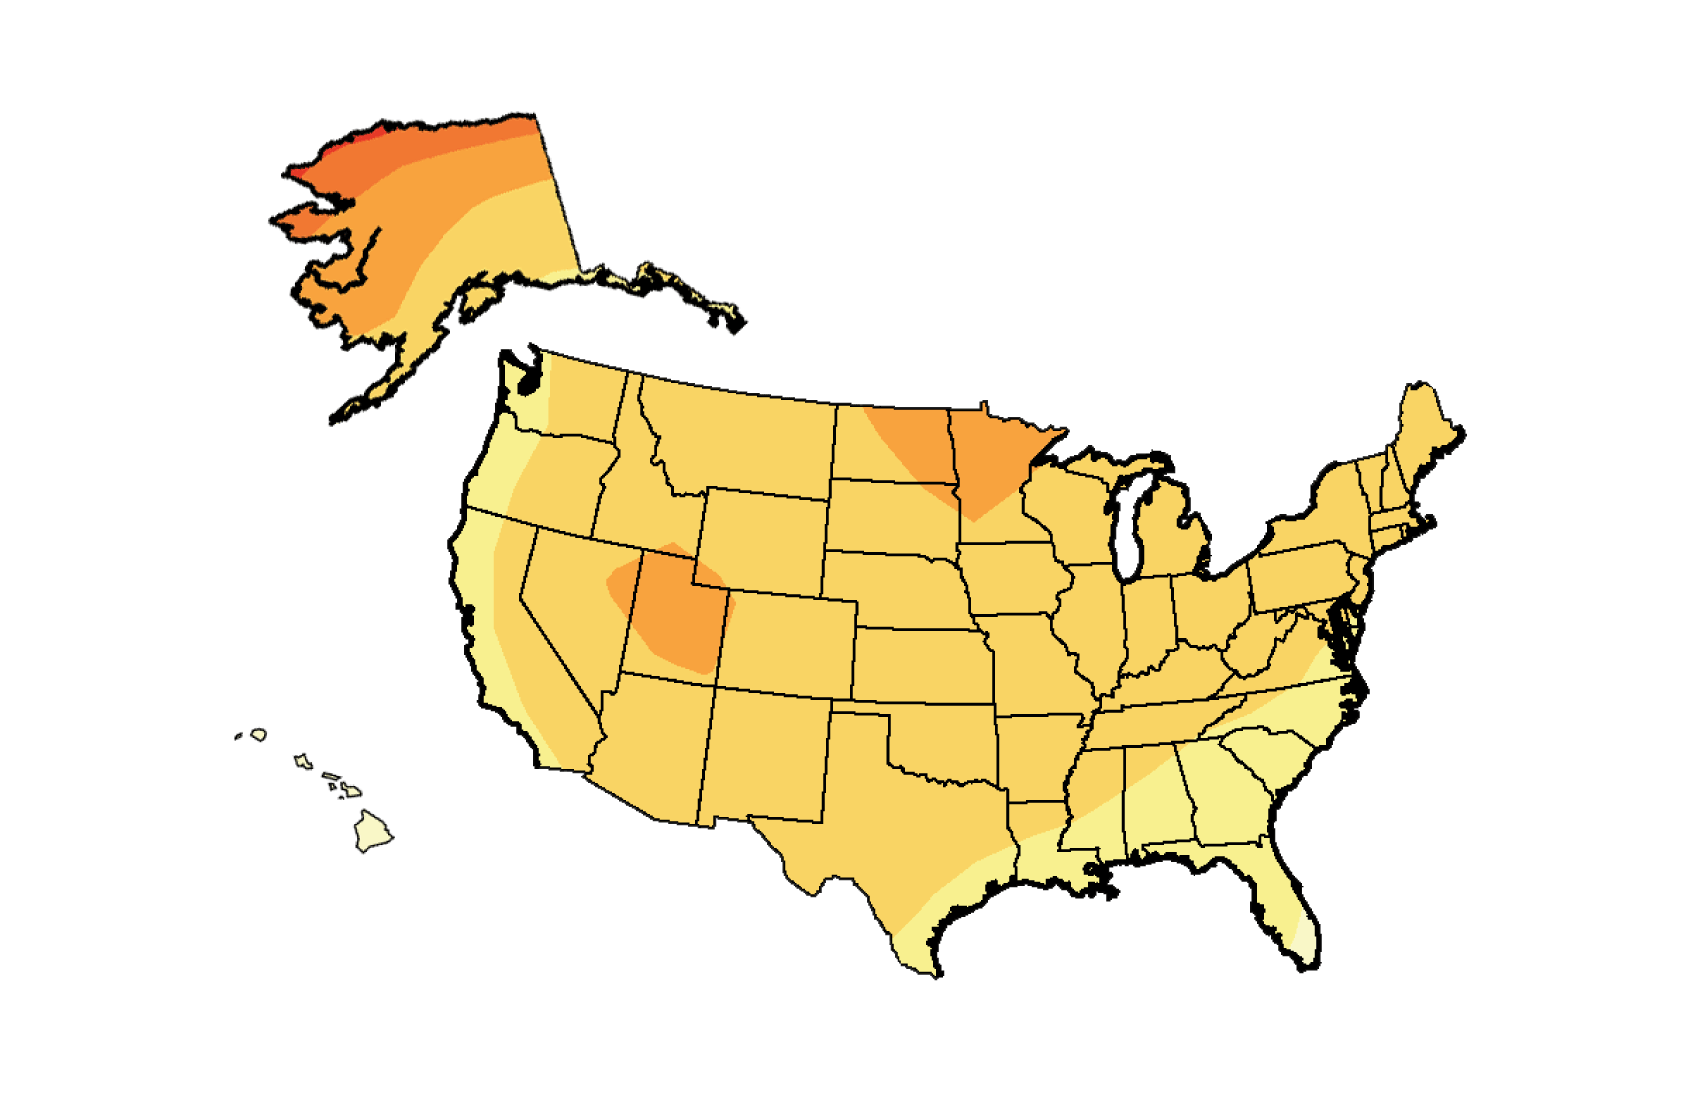
- Based on current fossil fuel consumption the greenhouse heat-trapping gases we have already pumped and will continue to pump into our atmosphere will lead to a hotter and more violent climate future. The map below shows projected changes from average surface temperatures over the period from 1970 to 1999 and going to 2099. Note the more northerly and higher elevation areas of the country will experience the greatest rise. Data and future climate modeling is courtesy of NOAA.
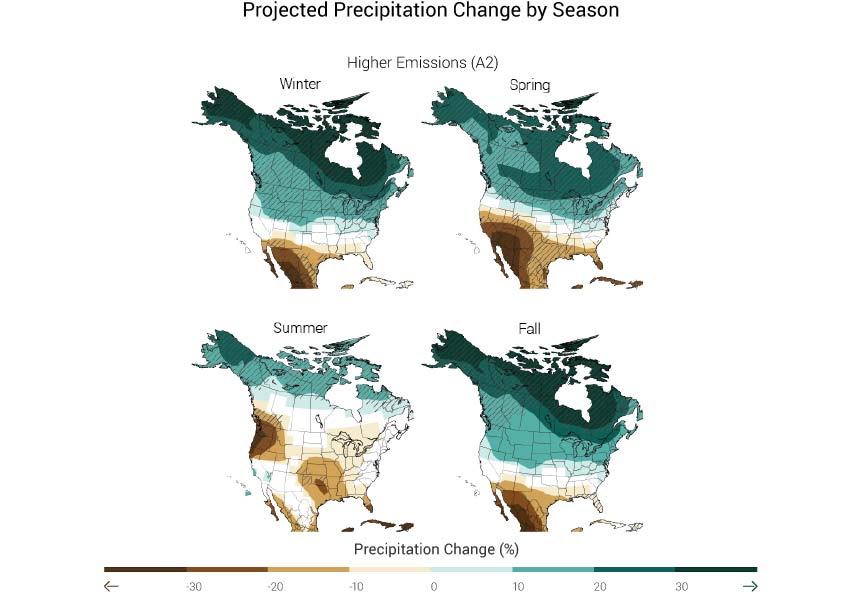
- Similar projections over the same time period have been made for the amount and distribution of precipitation with more northerly regions seeing increases in net amounts and southerly regions experiencing a net deficit. Note on the North American seasonal maps provided below the significant deficits in the prime agricultural heartland of the United States.
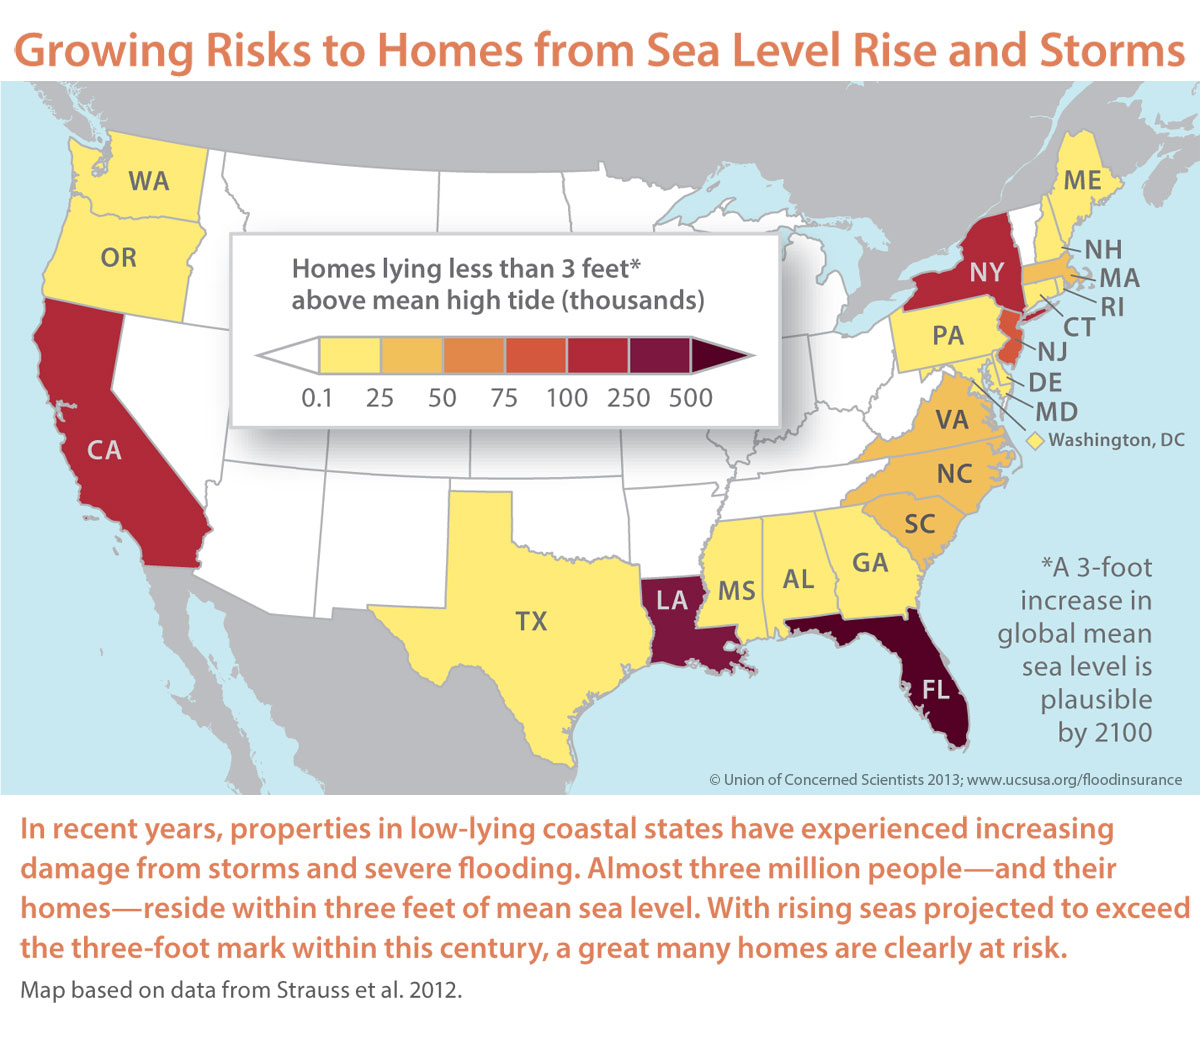
- Climate change impacts sea level. Since the 1880s levels have risen globally 20.3 centimeters (8 inches). By 2100 that number is projected to be as little as 30.5 centimeters (1 foot) or as much as 122 centimeters (4 feet). That’s because the oceans are the chief sequestering body on the planet for global warming and warmer ocean water expands. So it’s more than just glacial and sea ice melting that will contribute to the rising of sea levels. If sea levels rise somewhere between a foot and 4 feet, let’s say 2 feet, then the United States will lose 26,000 square kilometers (10,000 square miles) of territory. The map below plots the number of U.S. homes by state that would be at risk should sea levels rise 3 feet by 2100. Map source is the Union of Concerned Scientists.
In the end it isn’t just about warmer temperatures, extreme weather events and rising sea levels. It is about how a country’s infrastructure is built to cope with these changes. Storms like Hurricane Katrina and Hurricane Sandy caused massive critical system failures both at the local and national level. We may never see another Katrina or Sandy but based on projections of extreme weather events that is highly unlikely. Our capacity to respond to such devastating storms has shown incapacity and the investment needed to harden infrastructure is just not happening to the extent required. That leaves the country more vulnerable. And there is a further threat that without a hardened infrastructure each extreme weather event will further weaken the country’s ability to respond.
The threat to the agricultural heartland is just as real as storms like Katrina and Sandy. The decadal drought in Texas and California, the dropping water levels in the Colorado River Basin, the drying out of the Ogallala Aquifer, will sharply alter the ability of Mid-West farmers to produce yields of traditional food crops and livestock to meet national demand. Will the drying south and heartland be offset by the rise in precipitation and temperatures in places like the Dakotas, Minnesota and Montana? Will these areas become the new heartland for agriculture on the continent along with the Canadian Prairies to the north? Just look at the maps and place your bets.
And along with rising temperatures in areas of the country that have never experienced them will come the invasion of insect pests along with diseases previously unknown to regions of the country. Malaria, Dengue Fever, Lyme Disease, West Nile Virus, Tularemia, Rocky Mountain Spotted Fever, Chagas Disease, Chikungunya and Rift Valley Fever are just a few among many diseases that will become more threatening as temperatures rise. That’s because the carriers that transport these diseases will find an expanding range in which to thrive.
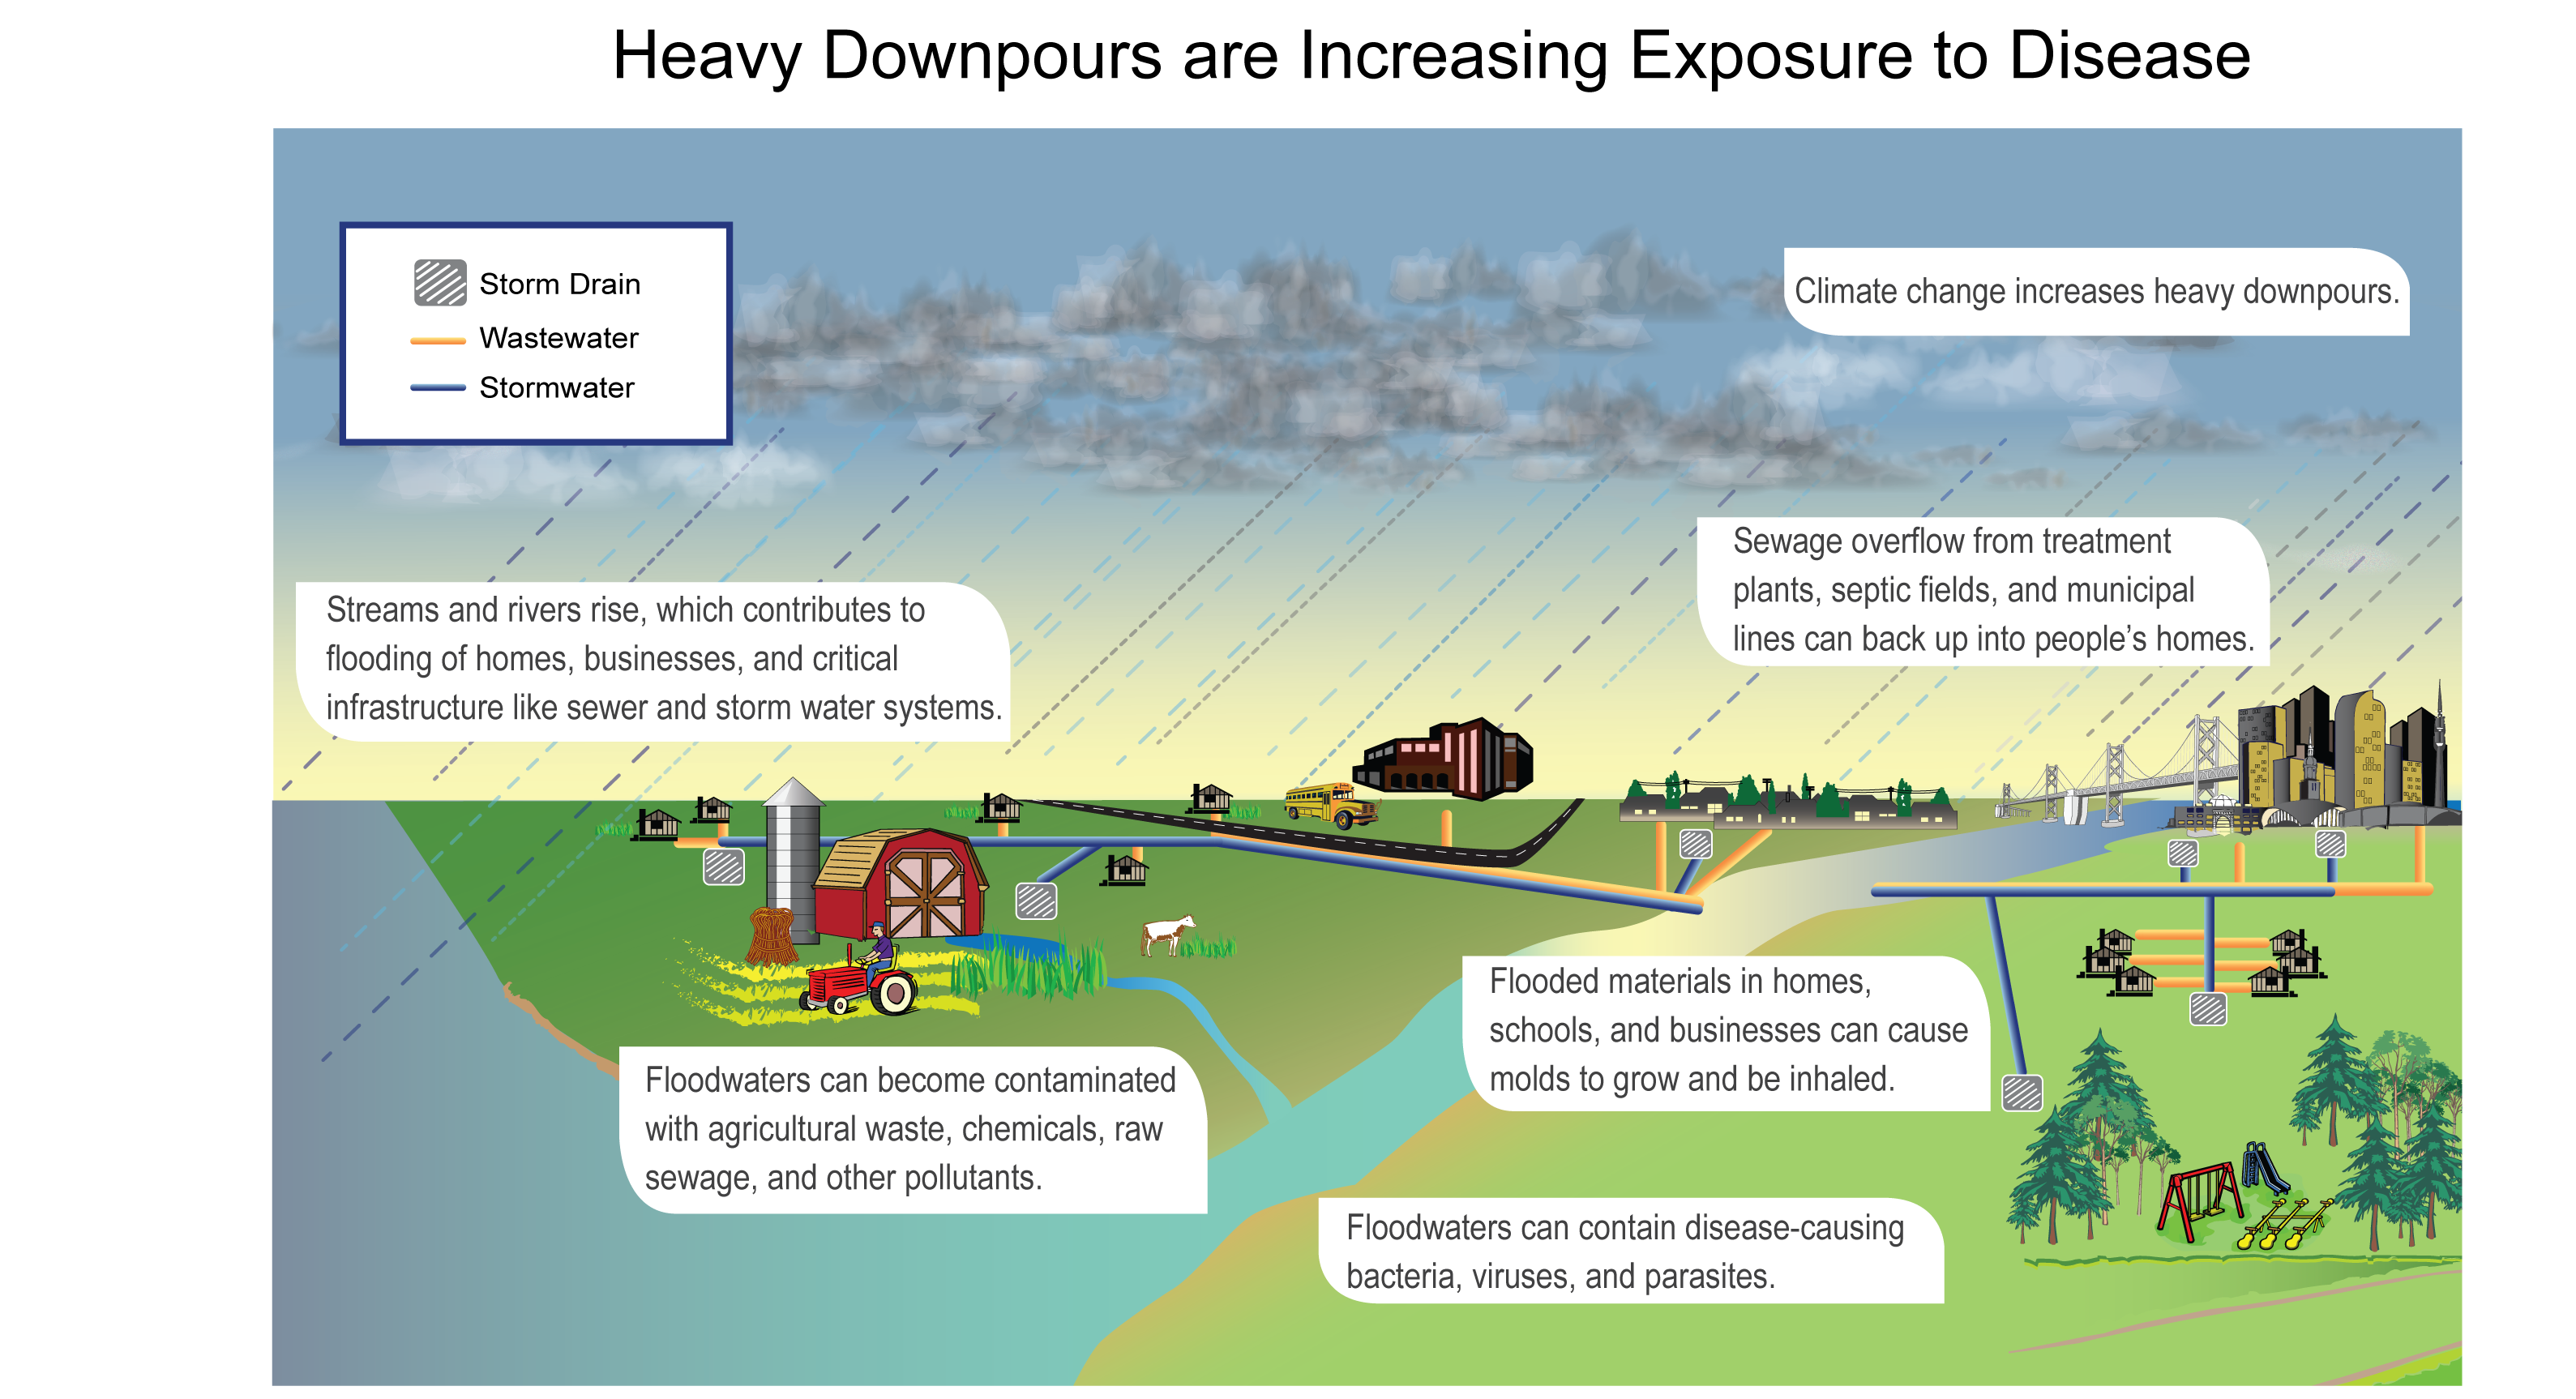
Increased CO2 in the atmosphere is contributing today to increases in allergies. Extreme rainfall is enhancing growing conditions for fungi and molds. We are at risk for higher incidents of asthma and other respiratory conditions. Sudden heavy rains overwhelm septic systems and municipal treatment plants putting us risk for waterborne pathogens and diarrheal illnesses. And those same stream swollen by rains will also contribute to agricultural land loss, soil erosion, spills of chemicals and other pollutants into lakes, rivers and oceans. In the illustration below we see a depiction of how heavy precipitation events increase people’s exposure to risk. The source is NOAA.
For the scientists who have written this report there is no “I told you so” in their descriptions and tone. They recognize that the country needs to adapt to the reality that we are living with climate change in the present and seeing its early impacts. We have two tasks ahead of us. The first is to mitigate the most extreme outcomes of our global dependency on fossil fuels by reducing our use of these greenhouse gas contributors. But that is not enough. The second is to develop adaptation strategies to ensure that we ride out the storm of global climate change in the best possible shape.
There is a price to be paid for all this change brought on by climate. There is a need for a shifting mindset on the part of citizens so that conservation, reduction, renewable and sustainable become the words that march us through the rest of the 21st century. This is what this climate assessment is telling us and if we don’t listen, we do this at our own peril.
The link to the entire report can be found in the opening sentence of this posting. Or you can watch this short video which provides a summary of what has been learned. Whichever you choose you owe it to yourselves to learn more about how climate change will impact you where you live.
Related Posts
 Will We Soon Have a Cholesterol Vaccine?
 Have We Learned Anything From The COVID-19 Pandemic?
 The Nuclear Arms Race Never Ended
 Adjusting Time as the Polar Ice Caps Melt Causing Earth Spin Rate to Change
 We Use Laundry and Dishwashing Pods – Are They an Environmental Hazard?
 When It Comes To Hunting For Life on Exoplanets Purple May Be The New Green
 Canada is Becoming a Nuclear Fusion Hotbed
 Conversations About AI: Will Human Software Coders Soon Be Obsolete?


