
January 23, 2018 – Who are actuaries and what do they do? Actuaries are people who study numbers. They choose to become actuaries taking courses in business, accounting, and economics. They spend 6 to 10 years in post-secondary programs. In the end, their statistical expertise makes them invaluable to those who assess risk. Where they get employment is in consulting firms, insurance and reinsurance companies, and government. Their analysis of the numbers helps insurance companies determine the rates clients pay for life, health, property, and casualty policies. And increasingly, they are the go-to source for the public in understanding climate change risk.
Introducing the ACI
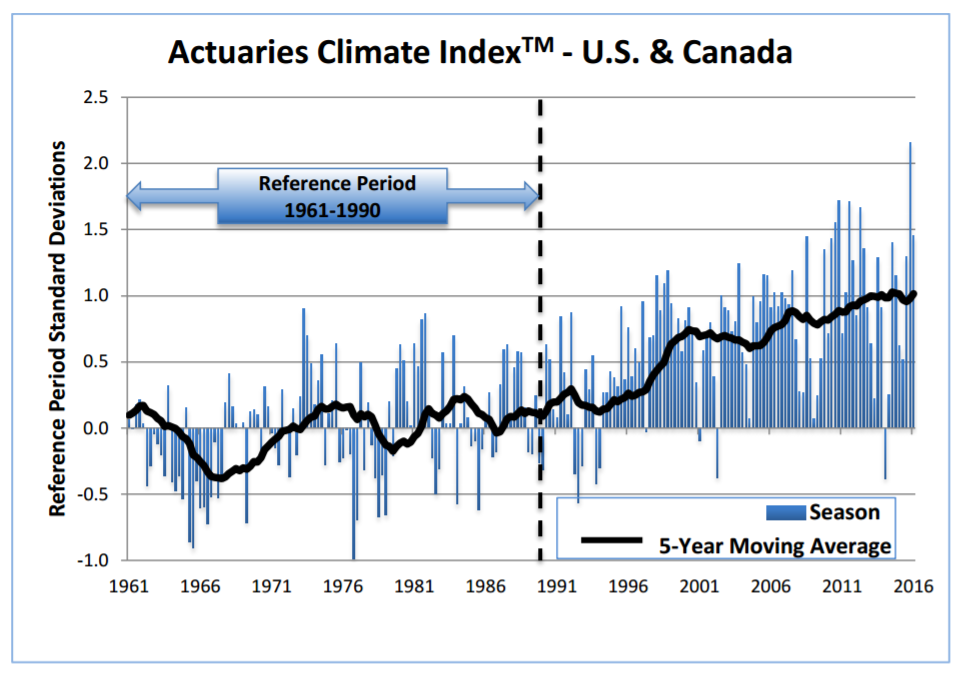
In 2016 a collaboration of U.S., Canadian, and worldwide actuarial professionals launched the Actuaries Climate Index (ACI). ACI compiles environmental data on six key variables to create a formula that produces a measurable indicator of trends. The plotting of the indicator uses as a baseline data from a reference period starting in 1961 and ending in 1990. The variables within the ACI formula include:
- High temperatures – a measure of the occurrence of warmer temperatures that exceed the 90th percentile above the reference period.
- Low temperatures – a measure of daily lows in comparison to the reference period.
- Heavy rainfall – measuring maximum rainfalls based on the number of consecutive days of precipitation in a year and the number of 5-day rainfall months against the reference period.
- Drought – measuring the number of consecutive dry days in a year and by month using the same reference parameters.
- High wind – a measure of daily wind speed in comparison to the same reference period.
- Sea level – a measure gathered from tide gauges at permanent coastal stations noting changes above or below the same reference period.
From these six variables, actuaries have created a complex calculation which leads to the ACI which can be plotted graphically.
ACI is one of a number of tools in an actuary’s portfolio to quantify risk related to weather and climate. Other tools include modeling which also helps to calculate risk. One of the greatest concerns for the profession is that the reality of global warming may lead to disasters in the near future for which actuaries cannot properly assess risk, and thus provide the much-needed advice that governments, business, and the general public seek in assessing climate change.
Two days ago an article appeared in Toronto’s The Globe and Mail, written by Bob Weber of The Canadian Press. It referenced the ACI and the participation within it of the Canadian Institute of Actuaries. It further described how Canada’s ACI index reveals a gradual increase in extreme weather events right across the country with mean temperatures climbing, hot days exceeding the normal number from quarter to quarter, and for the last nine years, cold days not. Canada’s ACI also indicates a country getting wetter and windier. And with sea level data from Atlantic Canada, the ACI shows above normal rising for the last 12 years.
In his article Weber quotes Caterina Lindman, of the Canadian Institute of Actuaries, who states, “We see definite trends that can’t be explained by normal variability… There’s a lot of political angst around the issue of global warming and we’re trying to be neutral sources…We’re in it for the long haul, so we are concerned for the sustainability of our planet.”
How real is our risk exposure in economic terms?
In the latest research from the ClimateWise initiative, a group of 28 insurance companies that since 2006 have been disclosing the risks associated with climate change, have their own data sets accompanied by dollars and cents. These insurers note there has been a 600% increase in extreme weather-related damages since 1950 and in the past 10 years, an insurance protection gap for governments, businesses, and families amounting to $1.7 trillion. According to ClimateWise the risk of underwriting exposure for many areas of the planet today makes them effectively uninsurable. ClimateWise is recommending that insurers develop resiliency ratings for all aspects of the business, from policy underwriting environmental risk to the investments made by the industry.
Climate change states Tom Herbstein, Senior Programme Manager at ClimateWise, leaves “the insurance industry with unprecedented levels of risk.” He describes the impact of a one-meter rise in sea level, which many climate scientists predict likely by 2100, as causing 100-year flood risk to rise by as much as 40 times for Shanghai, 200 times for New York City, and 1,000 times for Kolkata, India.